XRP’s On-Chain Boom vs. Falling Price: Reconciling 2.5M Daily Tx with a Descending Channel
Summary
Executive snapshot
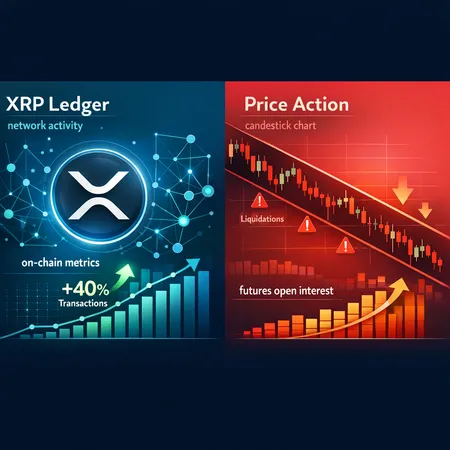
XRP is exhibiting a classic decoupling: on-chain momentum is accelerating while the market price stubbornly tests lower levels. Recent reporting shows a roughly 40% surge in daily XRP Ledger transactions to nearly 2.5 million per day — an unequivocal on-ledger usage signal — even as the chart prints a clear descending channel and episodes of liquidation-induced volatility. For token investors and market analysts this creates a two-speed story: improving utility and engagement on-chain versus short-term technical weakness in the market.
What the on-chain numbers actually show
Data-oriented headlines are blunt: the XRP Ledger experienced a near-term spike in network activity, a 40% uptick that pushed daily transactions close to 2.5M/day. That level of throughput is material because it means more accounts are interacting with the ledger, whether for payments, token issuance, DEX trades, or other services. The reporting behind the metric also notes that this is not a tiny blip — it’s a meaningful jump in baseline activity that deserves attention (Coinpaper on network activity).
Why would daily txs increase? A few plausible drivers:
- Payments and remittances: XRP’s low-fee, high-throughput characteristics still make it attractive for settlement rails and micropayments.
- On-ledger tokenization: more issuances and gateway activity (stablecoins, tokenized assets) create higher transaction counts even if not all flows are speculative.
- Utility growth from new apps: DEX activity, atomic swaps or other services that live on the XRP Ledger can add many small transactions that accumulate rapidly.
- Batch processing and bridges: integrations or relays that push batched transactions can inflate tx counts without equal changes in active users.
On-chain metrics like daily transactions and active addresses are forward-looking in a behavioral sense: they measure actual usage rather than mere price sentiment. But usage does not equate to immediate price appreciation — monetization and token flow dynamics determine how activity translates to demand.
Why futures open interest can rise even as price struggles
A companion signal — rising futures open interest — seems to amplify the paradox. Recent coverage points to growing X/RP futures OI, which is a separate layer of market engagement (Coinpaper on futures OI). How do we square higher OI with a descending price channel? Several mechanisms explain it:
- Hedging and institutional participation: institutions and market makers may use futures to hedge on-chain exposure, raising OI without creating directional pressure.
- Leveraged positioning and volatility bets: higher OI often means more leveraged bets are being placed — shorts and longs alike — which can increase counterparty risk and liquidation sensitivity.
- Options and basis trades: some participants use futures as part of delta-hedged options strategies or basis trades, increasing contract volumes even if cash-side demand is muted.
- Trading conviction despite weak price: rising OI can reflect new conviction (both bullish and bearish) building at lower prices — traders are positioning for the next directional move.
Importantly, rising OI plus falling price can be a bearish combustion chamber if much of that OI represents short positions. Conversely, if a large chunk is long hedging by entrants buying the spot and selling futures, the unwinding can produce complex flows. Neither metric — OI nor daily txs — alone gives the full picture. Combined, they reveal heightened engagement on both the chain and the derivatives market, and that the stakes are rising.
The technical picture: descending channel and recent liquidations
Technically, XRP has been capped by a descending channel for several sessions, which has frustrated upside attempts and created a reliable resistance slope that traders are watching closely. Technical coverage highlights the channel’s role as the prevailing short-term trend-defining structure (Crypto.news on the descending channel).
At the same time, markets experienced sizable liquidations and volume spikes that amplified downside moves. Reports of roughly $435 million in liquidations and warnings from Bollinger-type squeezes underscore how fragile short-term liquidity has been (U.Today on liquidations). Liquidations do two things: they accelerate directional moves and they concentrate risk in the hands of surviving participants — making subsequent reversals either sharper (short-squeezes) or more extended (prolonged selling).
Key technical observations to watch (use these as a framework rather than absolute levels):
- Upper channel resistance: the descending channel’s upper trendline is the first-level filter for bullish invalidation. A decisive, high-volume break above this slope would change the near-term narrative.
- Horizontal support cluster: prior daily/weekly support zones (where buyers previously concentrated) matter — watch how price behaves at these levels on low-latency timeframes.
- Moving-average confluence: the 50-day and 200-day moving averages (and where they cross) can give context to longer-horizon positioning and institutional risk thresholds.
- Volume and on-chain flows: watch exchange inflows/outflows, token movements tied to large wallets, and persistent changes in daily tx composition.
A clean breakout with rising volume and falling exchange supply would be the textbook bullish confirmation. Absent that, the channel stays the dominant guide.
Market-structure implications: liquidations, squeezes, and longer-term adoption
The coexistence of stronger on-chain activity and fragile price structure creates a few non-linear market dynamics:
- Amplified liquidation cascades: rising OI and high leverage make liquidations more likely when stops are clustered. A relatively modest move can cascade if many positions are similarly sized and poorly collateralized.
- Short-squeeze potential: if OI turns heavily short and on-chain adoption signals trigger rotational buying, a squeeze could produce a fast, sharp rally — often leaving technical traders flat-footed.
- Divergent time horizons: long-term holders and ecosystem users may care more about on-chain metrics (utility, tx growth), while traders are focused on liquidity, leverage, and technicals.
- Utility vs. speculation mismatch: higher on-chain volumes can indicate real adoption but don't guarantee immediate buy-side pressure. If most activity is non-protocol-native (e.g., tokenized stablecoin settlement), the price may not respond as strongly.
Put simply: the market is more crowded and more brittle. That raises both downside and upside tail risk.
Scenario-based playbook (for traders and long-term holders)
Below are practical, scenario-driven actions tied to differing market outcomes. This is analysis, not financial advice — tailor any plan to your risk tolerance and timeframe.
Scenario A — Bear continuation (channel holds, price breaks lower)
- Traders: reduce directional exposure or tighten stops; prefer short-duration strategies (scalp/shorts) with strict risk controls. Use defined-risk instruments (options) rather than unconstrained leverage. Watch for liquidation clusters as trade opportunities but size positions conservatively.
- Holders: consider incremental dollar-cost averaging only if conviction is multi-year and fundamentals (on-chain adoption, ecosystem growth) remain intact. Keep a buffer of dry powder for lower-entry points.
Scenario B — Range-bound / building base (channel persists, no decisive break)
- Traders: focus on range strategies — buy low in the support band and sell near the channel top — but keep risk tight. Monitor futures OI shifts: growth in OI at the top of the range suggests an eventual breakout or violent unwind.
- Holders: use this period to monitor on-chain metrics like active addresses, daily tx composition, and exchange flows. Platforms such as Bitlet.app illustrate how product demand can mature even while price consolidates.
Scenario C — Bull breakout (price breaks above channel with volume and falling exchange supply)
- Traders: scale into momentum trades after a confirmed breakout (retest of the break level with volume support). Consider directional futures or spot accumulation with clear stop-loss levels to survive any shakeouts.
- Holders: a breakout confirmed by continued on-chain growth makes a stronger case for strategic accumulation. Re-evaluate thesis: does increased ledger activity translate to higher token utility and reduced selling pressure?
Across all scenarios, priority checklist for risk management:
- Monitor futures open interest and funding rates: rising funding rates can penalize certain carry trades and incentives can flip quickly.
- Watch exchange inflows/outflows and large wallet movements: sustained outflows are bullish; concentrated inflows are a red flag.
- Use position sizing and stop rules: avoid oversized bets relative to account equity, especially when leverage is available.
- Track on-chain metrics beyond raw txs: active addresses, new accounts, token issuance rates, and merchant/gateway activity give a fuller picture.
Practical signals to monitor daily
- Daily transactions (XRP Ledger): Is the 40% spike persistent or reversionary? A sustained plateau higher than recent history matters.
- Futures open interest and funding rates: OI growth with neutral or negative funding can point to a bearish skew; positive funding may favor longs.
- Exchange flows: net outflows are constructive; sudden inflows often precede price pressure.
- Liquidation clusters: identify price bands historically associated with large stop placement to anticipate squeeze risk.
- Network composition: are txs coming from new retail wallets, exchanges, bridges or tokenized assets? The source matters.
Final thoughts — reconciling adoption with price
A rising number of daily transactions on the XRP Ledger and higher futures open interest together tell a story of engagement — both in the ledger’s utility and in derivatives markets. But engagement is not the same as immediate price strength. The descending channel and liquidation episodes highlight short-term fragility that can persist until buyers demonstrate conviction through volume, exchange outflows, and durable positioning.
For investors and analysts the right stance is one of controlled optimism: monitor evolving on-chain metrics as a lead indicator of structural adoption, but respect short-term market structure and leverage-related risks. Technicals provide timing; on-chain metrics provide context. Use both to form a rounded thesis rather than letting one signal dominate your decision-making.
For further reading and to track the underlying reports cited here, see the sources below.
Sources
- Coinpaper — XRP Ledger network activity spikes ~40%: https://coinpaper.com/14835/xrp-ledger-network-activity-blasts-off-40-spike-2-5-m-daily-transactions?utm_source=snapi
- Coinpaper — Rising XRP futures open interest coverage: https://coinpaper.com/14831/xrp-futures-fire-up-1-66-b-signals-confidence-spiking-and-rising-market-pressure?utm_source=snapi
- Crypto.news — Technical coverage on XRP’s descending channel: https://crypto.news/xrp-stuck-in-range-as-descending-channel-caps-upside-momentum/
- U.Today — Liquidations and Bollinger-band warnings: https://u.today/xrp-faces-further-downside-risk-after-435-million-in-liquidations-bollinger-bands-warn?utm_source=snapi
Note: For on-chain context, analysts often cross-reference metrics such as active addresses, exchange flows, and token issuance to triangulate whether daily transaction spikes reflect durable adoption or transient technical flows. Also see commentary on broader markets and related assets like XRP and DeFi trends on DeFi platforms for comparative context.