Bitcoin Technicals: Stochastic RSI Echoes of 2022 and the Odds of a Near-Term Short Squeeze
Summary
Why the stochRSI comparison to late‑2022 matters
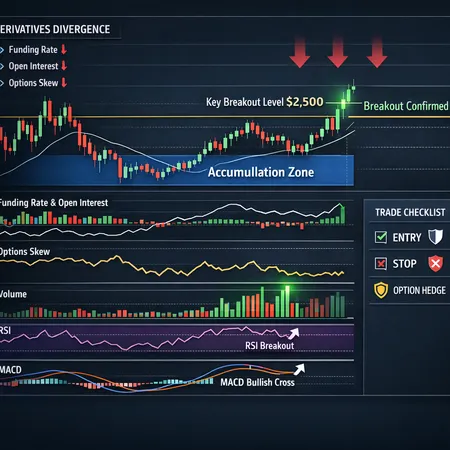
Technically, the stochastic RSI (stochRSI) is a momentum oscillator of an oscillator — it magnifies short-term extremes in the standard RSI. That sensitivity is useful for spotting potential sharp reversals, but it can also whip traders if used alone. Recently, several analysts observed that Bitcoin's stochRSI profile is tracking a pattern nearly identical to the run-up out of the 2022 bear market low: an oversold wash, a rapid climb into neutral/overbought readings, then consolidation before the next leg higher. Cointelegraph's comparison of today’s stochastic RSI to the end‑2022 rebound highlights that resemblance and is worth reading for a frame of reference (see their analysis for charts and timing).
The practical takeaway: whenever stochRSI looks like a previous squeeze/rebound, you should treat it as a conditional signal — not a certainty. Confirmation from price action, trend structure, and derivatives flows is required before calling a high-probability short squeeze.
Key momentum thresholds and what to watch
Traders commonly use a few numeric anchors with stochRSI and related indicators:
- Stochastic RSI: classic thresholds are <20 = oversold** and **>80 = overbought. Crosses of 20→up or 80→down are the early triggers.
- Regular RSI (14): readings around 50 act as midline confirmation; a sustained push above 60–65 signals stronger momentum.
- Moving averages: the 50‑day MA gauges short-term trend, 100‑day the medium trend, and the 200‑day the long-term trend. Price reclaiming and holding above these moving averages increases the odds of follow-through.
- Volume & breadth: breakthrough on above‑average on‑chain or exchange volume lends credibility to breakouts.
How to combine them: a cleaner bullish scenario for a squeeze would look like — stochRSI crossing up out of <20, spot RSI moving above 50, and price clearing the 50‑day MA on strong volume. A bullish confirmation level could be a decisive daily close above the 50 or 100 MA accompanied by rising open interest or ETF flows. Conversely, failure to hold those levels (especially a daily close below the 200‑day MA) invalidates the bullish thesis.
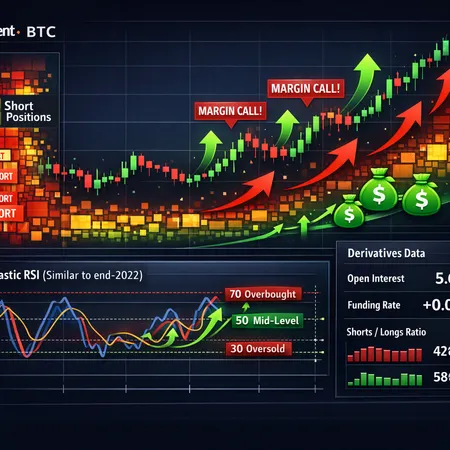
The derivatives backdrop: why shorts matter right now
Derivatives positioning is the ignition source for many sharp squeezes. When many traders are net short and price moves quickly higher, two engines create velocity: forced short-covering (buy to close) and margin/liquidation cascades. Recent market commentary — citing Santiment — highlights a souring mood and notable concentration of large short positions across exchanges. NewsBTC summarizes Santiment's data on the high short interest; that imbalance is precisely the raw fuel a squeeze needs.
Practical metrics to monitor daily:
- Exchange open interest (per USD): spikes or rapid increases during a price move suggest leverage is amplifying the move.
- Funding rates: very negative funding rates show shorts paying longs; a quick shift from negative to neutral/positive accelerates short-covering.
- Liquidation clusters: watch for price levels where many shorts and margin accounts have their liquidations set — these often sit just above local resistance levels.
When ETF inflows or organic buying hits while open interest is high and funding is negative, the market can flip quickly. That interplay is why traders should not ignore order book asymmetries and options skew around strikes close to current price.
ETF inflows: adding durable demand to a technical setup
Institutional flows matter. Decrypt reported a one‑day Bitcoin ETF inflow of roughly $471 million — the largest single‑day haul since February — which is not just noise. Those flows represent buy-side pressure that can be systematic and persistent, especially if they coincide with rebalancing and allocator buying windows. When ETFs add liquidity to an already tight market, they reduce the available sell-side depth and can magnify squeezes.
ETF flows interact with technical setups in two ways:
- They raise the baseline bid pressure: sustained inflows make it easier for price to clear technical resistance because natural sell liquidity thins.
- They create predictable buying events (e.g., creation/redemption flows, end‑of‑day settlement) that traders can map to likely times of higher upward pressure.
Combine that with a derivatives book loaded with shorts, and the ingredients for a rapid squeeze are present. Keep in mind: ETF flow timing and exchange settlement windows can concentrate moves into short windows of the trading day.
Tactical framework: entry, sizing, and risk controls for a possible squeeze
Below is a pragmatic playbook for intermediate traders who want to participate while managing asymmetric risk.
Define the thesis and the trigger
- Bullish squeeze thesis: a technical momentum flip (stochRSI up out of <20 and daily stochRSI confirmation), RSI >50, and price clearing the 50‑day MA on above-average volume, while ETF inflows or large buys are visible and exchange open interest is elevated.
- Trigger: either a clean daily close above the trigger MA or an intraday breakout with volume greater than the prior 14‑day average.
Position sizing rules
- Risk per trade: limit to 1% of account equity on the initial position; consider scaling to a max of 2–3% if the thesis is strong and confirmed.
- Volatility-adjusted sizing: use ATR (14) to set stop distance. Example: stop = 1.5–2× ATR; position size = risk капитал / stop distance.
- Leverage cap: if using margin, keep leverage <3x for directional trades; for higher leverage, reduce position size proportionally.
Stop placement and active management
- ATR stops: place stops below technical invalidation (e.g., below the 50‑day MA or a recent swing low) and size via ATR so the stop reflects current volatility.
- Rolling stops: on sustained move, shift stops to breakeven + a small buffer to eliminate downside risk.
- Option hedges: for traders who prefer asymmetric risk, buy calls or call spreads instead of taking naked leverage; to protect upside exposure, buy puts or use collars.
Options and advanced tactics
- Call spreads: cheaper than outright calls, reduce Vega exposure while preserving upside participation.
- Buy protective puts if you hold a large spot allocation and want downside insurance during a squeeze attempt.
- Short-dated options: useful for targeting a tactical squeeze window (e.g., around ETF settlement or macro events) but beware of time decay.
Liquidity and exits
- Partial exits on first major resistance (e.g., previous high, options strike with large OI). Sell a tranche to lock profits and let the remainder run with a trailing stop.
- Watch funding rates and open interest. If funding turns wildly positive and open interest peaks with heavy call buying, the move may be extended; if funding flips negative mid‑move, be prepared for chop.
Scenario-based adjustments
- If a clean breakout happens with ETF inflows visible and funding rates climbing: consider scaling in (e.g., add 25–50% of initial size on confirmation), tighten stops on earlier tranches.
- If price spikes but closes poorly and stochRSI immediately re-enters overbought (>80) with waning volume: reduce exposure and favor profit-taking.
- If macro events coincide (rate announcements, CPI): tighten risk and consider reducing leverage regardless of technicals.
Monitoring checklist (daily and intraday)
- Stochastic RSI (daily and 4‑hour): watch for momentum flips and exhaustion.
- Regular RSI and MA status: 50/100/200 daily reads.
- Exchange open interest and funding rates: large shifts can presage squeezes.
- ETF flow reports and block trades: use institutional flow signals to anticipate buying windows (the Decrypt piece documents one such impactful inflow).
- On‑chain/social signals: Santiment and similar services can flag concentration of bearish sentiment and large short positions.
Practical examples (how this could play out)
Example A — Gradual squeeze: stochRSI climbs out of oversold, price reclaims 50‑day MA on heavy ETF-driven volume, shorts begin to cover, funding swings toward neutral, open interest rises. Trader strategy: scale in, set ATR stops, trim into strength.
Example B — Fake breakout: intraday spike fueled by algo buys or wash trades, stochRSI spikes above 80 but volume quickly dries, price reverses. Trader strategy: take profits on first tranche, tighten stops, avoid adding into the chop.
Final considerations and risk reminders
No indicator — including the stochRSI — is a crystal ball. The 2022 comparison is useful as a template, but market internals, macro events, and institutional flows (like the ETF inflows noted in Decrypt) change how history repeats itself. Santiment’s note on large short positions underlines the asymmetric risk if a bid appears; that's precisely why prudence in sizing, stop placement, and use of hedges matters.
Bitlet.app users and traders should treat these signals as part of a broader risk-managed playbook: confirm across multiple indicators, set sensible stops relative to ATR, monitor derivatives metrics, and size positions so one squeeze or reversal doesn’t significantly impair the portfolio.
Sources
- Cointelegraph: Bitcoin RSI nearly perfectly copying end‑2022 bear market analysis
- NewsBTC (citing Santiment) on market mood and large short positions
- Decrypt: Bitcoin ETFs add $471M in biggest one‑day haul since February
For broader context on on‑chain momentum and derivatives reading, many traders also cross‑reference social sentiment trackers and exchange flow monitors. For basic primer pieces and tag‑based content, see Bitcoin and discussions about capital flow into crypto and traditional markets like DeFi.