Solana Risk Assessment After the Drift $285M Exploit: Price Damage, Supports, and Actionable Trading & Validator Controls
Summary
Quick read: what happened and why it matters
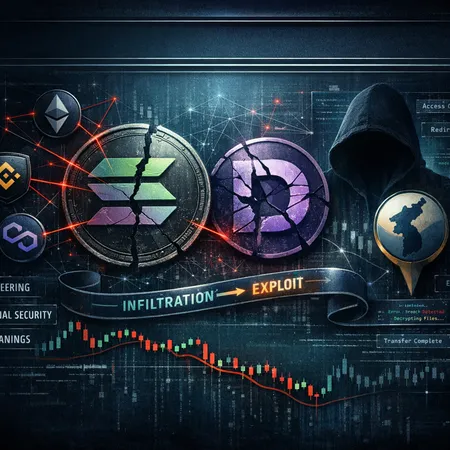
The Drift Protocol exploit (~$285M) is not just a DeFi headline — it’s an acute liquidity and sentiment shock for the Solana ecosystem. Beyond the immediate theft, a large-scale exploit creates two channels of market damage: (1) direct sell pressure as exploit proceeds hit exchanges or lending markets, and (2) contagion-driven risk-off that compresses liquidity across SOL-denominated markets and related DeFi protocols.
Traders should treat the event as a multi-day risk event, not a single candle. Validators and node operators must assume elevated adversary interest (ranging from on-chain tracing attempts to off-chain sanctions/pressure). For many market participants the episode re-anchors concern around Solana’s DeFi risk profile and smart contract supervision — the same themes that drive longer-term flows in DeFi and occasionally around macro hedge narratives like Bitcoin.
Immediate price action: quantifying the short-term damage
Observed move and what to expect in the next 24–72 hours
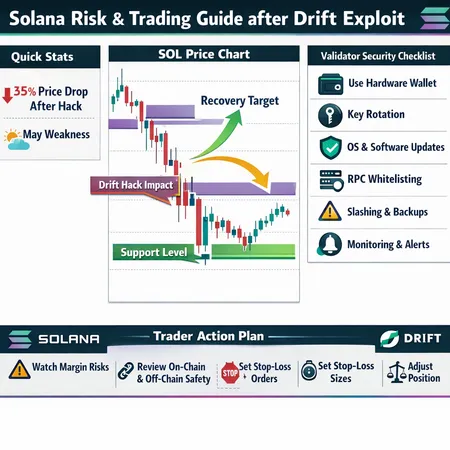
Market reactions after large exploit headlines typically follow a damage curve: a sharp intraday drop, a short-lived bounce as opportunistic buyers test the depth, then a multi-day period of elevated volatility while the community and exchanges react. Early post-exploit analysis flagged a meaningful intraday drop for SOL and a technical breakdown through near-term support bands.
Conservative quantification for short-term damage: expect an initial shock of roughly 8–20% from the pre-exploit reference price (this range captures the typical window for large DeFi-linked shocks). If exploit proceeds are moved on-chain and partially converted into stablecoins or BTC, that can reproduce further selling and extend the drawdown into the 15–30% range before a capitulation low.
Why ranges not exact numbers? On-chain tracing, exchange custody, and attacker behavior (slow laundering vs. rapid exits) create different sell-pressure profiles. The three scenarios below map those behavioral variants.
Key support and resistance bands to watch
- Immediate resistance (bounce ceiling): prior consolidation and short-term VWAP. Expect sellers to defend roughly ~5–12% above the post-exploit low.
- Near-term support: shallow buyers will show up within ~5–15% below the low — this is the “dip-buy” zone for short-term traders.
- Structural support: a stronger buyer concentration usually exists ~15–30% below the pre-exploit level; if broken, technical damage becomes deeper and recovery takes longer.
Practically: translate these to numbers relative to where you trade SOL. If SOL was trading at $X before the exploit, plan for a primary reaction zone of X*(0.80–0.92) and a deeper structural band at X*(0.70–0.85). Always recompute these bands live — levels shift if on-chain flows show aggressive selling.
Three plausible recovery scenarios (timelines and triggers)
Scenario A — Rapid stabilization (48–96 hours)
Trigger: attacker’s proceeds remain unmoved or exchanges quarantine funds; market interprets the hack as isolated to DRIFT. Outcome: volatility subsides, a V-shaped bounce tests prior support-as-resistance, and SOL recaptures 50–70% of the initial drop within a week.
Scenario B — Prolonged weakness (1–4 weeks)
Trigger: partial laundering, selective exits on centralized venues, or widening contagion to other Solana DeFi projects. Outcome: SOL grinds lower, retests structural support bands, and seasonality (May weakness) amplifies downside as liquidity thins.
Scenario C — Deep structural sell-off (4+ weeks)
Trigger: aggressive conversion of exploit funds, coordinated liquidations, or a cascade of protocol insolvencies. Outcome: SOL breaks long-term supports, leading to a multi-week recovery window measured in months rather than weeks.
Which is likeliest? Current evidence points at Scenario B as the base case — elevated but not terminal risk — with Scenario A possible if on-chain tracing and exchange action halts attacker flows. Scenario C requires broader systemic failures.
Seasonality and the May risk window
Historical intrayear seasonality data shows pockets of recurring weakness (liquidity falls, portfolio rebalances) around calendar transitions. Multiple technical commentators flagged possible May softness for SOL driven by sell-side rebalancing and historically thinner order books in that window. If exploit-related selling collides with seasonality, downside velocity accelerates and support bands can fail faster than models expect. Traders should not treat calendar noise as benign — it’s a multiplier on any liquidity shock.
A concise SOL trading plan: rules of engagement
Position sizing & allocation
- Reduce spot exposure by 20–50% from pre-exploit allocations until on-chain clarity improves.
- Cap new directional trades to conservative sizes (e.g., <2–3% of portfolio risk per trade) and avoid scaling into large positions during elevated volatility.
Leverage & margin
- Enforce hard maximum leverage limits: no more than 2–3x on perp futures during the first 72 hours post-exploit. For less liquid venues, prefer 1x.
- Maintain a margin buffer of 25–50% above computed maintenance margin to avoid cascade liquidations.
Stop-loss and execution
- Prefer time-bound stop rules (if price remains below X for Y hours, exit) over tight intraday stops that can be gapped out by volatility.
- Use TWAP/limit ladders for large exits to avoid market impact.
Hedging and derivatives
- Hedging preference order: inverse futures (short), buying puts, or structured collars. Options are ideal for tail protection if available and liquid.
- If using perpetuals, monitor funding rates — they will often spike and can make short hedges costly long-term.
Example: short-term hedge ladder
- Small outright short on perp to capture immediate downside (size = 10–20% of spot exposure).
- Buy puts equal to 15–30% of position value for tail protection.
- Keep cash collateral to cover margin spikes and option premiums.
Validator/operator security checklist (practical, prioritized)
1) Key management and HSM use
- Move validator signing keys into a hardware security module (HSM) or air-gapped signer where possible. Rotate operator keys and enforce multi-sig for critical administrative actions.
2) RPC and network hardening
- Rate-limit RPC endpoints, restrict access to known IPs when possible, and separate RPC endpoints from transaction signing infrastructure.
3) Monitoring and alerting
- Deploy continuous alerts for unusual staking activity, slashing warnings, large outgoing transactions from on-chain-managed accounts, and abnormal mempool behavior.
4) Software hygiene and patching
- Apply critical upstream patches promptly, pin client versions conservatively, and test upgrades on staging nodes before mainnet rollouts.
5) Validator isolation and backstops
- Segregate vote-signing keys from wallet/withdrawal keys. Maintain a cold backup of keys and an emergency playbook for quick voluntary stake-offload or operator handover.
6) Operational redundancy
- Run multiple validators with staggered maintenance windows, set up hot standby operators with pre-approved governance/keys, and ensure secure communication channels among operator team members.
7) Legal / compliance readiness
- Maintain records of node control, pre-authorized instructions for stake movements, and an escalation list including exchange contacts if you must coordinate to freeze attacker flows.
Validators should prioritize quick, verifiable controls: key isolation, RPC access, and monitoring. These steps reduce the chance of being an amplification point for attacker activity.
On-chain and off-chain risk controls for SOL holders
On-chain controls
- Move illiquid holdings to trusted cold storage rather than leaving large positions in integrated DeFi wallets.
- Use time-delayed, multi-sig vaults for treasury or large holdings to introduce friction against large one-off drains.
- Monitor on-chain flows: if a suspect address linked to an exploit begins funneling funds toward exchanges, treat that as a fresh liquidation catalyst and tighten risk controls.
Off-chain controls
- Keep exchange balances trimmed; prefer withdrawals to non-custodial wallets when you’re not actively trading.
- Use KYC-aware exchange balances sparingly; if you suspect sanctions or tracing, exchanges may freeze funds — that’s a different operational risk to manage.
Mentioning practical tooling: on-chain scanners and alerts can be integrated into operator toolchains; many traders and node operators monitor suspicious DRIFT-related addresses and public tagging feeds to anticipate selling waves.
Margin & derivatives considerations (practical rules)
- Avoid margin cross-collateralization across unrelated assets; isolate SOL positions so liquidation cannot cascade across your portfolio.
- Precompute liquidation prices under stressed volatility (simulate 15–30% intraday moves) and set margin top-up alerts well above those thresholds.
- Prefer options for convex tail protection rather than relying only on shorts: puts cap downside without exposing you to margin calls from funding spikes.
- If you must short using perps, stagger entries and set minute-based stop-limits to avoid being squeezed by sudden funding moves.
Communication & coordination steps (validators, traders, DAOs)
- Create an incident channel for rapid, authenticated communications among validators and major stakeholders. Coordinate with exchanges and law enforcement if attacker funds surface on centralized venues.
- Publish a brief post-mortem once initial facts are verified — transparency reduces rumor-driven selling.
Final checklist: 9 immediate actions (for traders & node operators)
- Reduce directional SOL exposure and cap new position sizes.
- Lower maximum leverage and increase margin buffers.
- Buy options or open conservative inverse positions as hedges.
- Withdraw non-trading balances from exchanges to cold storage.
- Harden validator keys (HSM, multi-sig) and isolate signing endpoints.
- Rate-limit RPCs and add IP allowlists.
- Deploy on-chain address monitoring for known DRIFT-related wallets.
- Prepare emergency stake/unstake playbook and test it.
- Coordinate communications with other operators and exchanges.
Closing: measured risk, not panic
Exploit events tilt markets toward caution. The useful posture is not to panic, but to adopt a staged, rules-based response: quantify your exposure, enact hard risk limits, and harden operational surfaces that attackers or market stress can exploit. For traders, that means lower leverage, deliberate hedges, and live monitoring of on-chain flows. For validators, it means immediate key hardening and operational redundancy.
Bitlet.app users and other traders should view this as a moment to tighten risk controls, not as an inevitable road to ruin — recovery is possible if selling is contained and contagion doesn’t widen. Track on-chain developments closely; re-evaluate size and hedges as attacker behavior and exchange coordination become clearer.