Bitcoin vs Gold: Saylor’s 36% Claim, Schiff’s Counter, and Portfolio Implications
Summary
Why the debate flared up — and what the numbers actually are
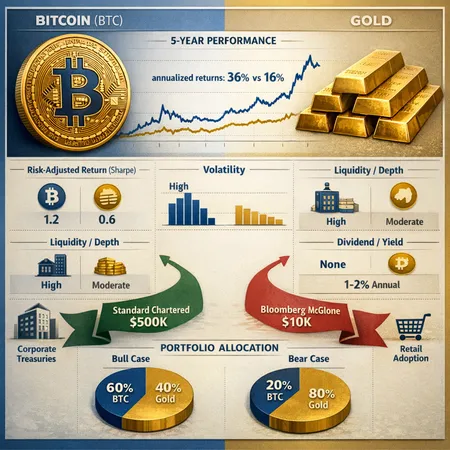
In early coverage of the spat, Michael Saylor stated that Bitcoin delivered 36% annualized returns versus 16% for gold, a soundbite that spread quickly and restarted a long‑running institutional argument about store‑of‑value supremacy. That exchange — and Peter Schiff’s five‑year rebuttals — are summarized well in recent reporting and scorecards Cryptopolitan and Cryptopotato. But headline annualized numbers hide a thicket of comparability issues.
The fundamental question for long‑term investors and advisors isn’t which headline is flashier; it’s which metric answers your goal: absolute growth, risk‑adjusted growth, drawdown control, or liquidity preservation. This article unpacks what each camp is measuring, reconciles seemingly conflicting five‑year scorecards, and places recent macro BTC price calls (both ultra‑bull and deep‑bear) into portfolio context.
What each side measures: total return, annualized return, and risk
Total return vs annualized return: Total return is the raw cumulative change in value over a period; annualized return converts that to a geometric mean per year. Short windows and large rallies create very different annualized numbers than long, steady performance. Saylor’s 36% figure is an annualized readout over a period that captures Bitcoin’s largest appreciation windows; using other start/end dates reduces the rate materially.
Timeframes: Five‑year windows are highly sensitive to start and end points. Bitcoin’s history to date has been punctuated by two multi‑year bull markets and deep drawdowns; gold is far smoother. Scorecards that use different five‑year endpoints will naturally disagree — which explains part of the Schiff vs. Saylor back‑and‑forth (see the Cryptopotato review of five‑year performance).
Risk and volatility: Raw return ignores volatility and sequencing risk. A 36% annualized return with 80% peak drawdowns is not comparable to a 16% return with single‑digit drawdowns unless you adjust for risk. Risk‑adjusted measures (Sharpe, Sortino, maximum drawdown) give a more realistic picture of capital preservation and usability in a diversified portfolio.
Carry and yield: Gold has implicit and explicit holding costs (storage, insurance) and in some cases is accessed through ETFs or futures that introduce financing/roll costs. Bitcoin has no coupon or dividend; its “yield” only appears through external products (staking for PoS tokens, lending markets) — so returns are pure price appreciation, which magnifies volatility.
Reconciling the five‑year scorecards
Why do different five‑year scorecards tell different stories? Three factors explain most divergence:
Window selection and base effects. Crypto returns are path‑dependent; starting at a local low yields a much larger annualized number than starting at a local high. Schiff’s counters often choose alternative five‑year endpoints to reduce the apparent BTC outperformance.
Asset definitions. “Gold” can mean physical bullion, futures, GLD shares, or a basket of metal indices. Each has different fees, liquidity and tracking error. Not all public scorecards standardize which gold instrument they use; that affects the denominator in any “BTC vs gold” ratio.
Adjustment for volatility and drawdown. A straight annualized return comparison ignores that a 36% number for BTC likely includes much higher realized volatility. If you compare Sharpe ratios rather than headline annualized returns, the picture narrows.
The upshot: headline annualized numbers are useful as attention magnets, but they’re insufficient for portfolio decisions. For a clearer comparison, use risk‑adjusted frameworks and standardized instruments (e.g., BTC spot vs. a specific gold ETF over an explicit start/end date).
Data comparability: dividends, volatility, liquidity, and transaction costs
Dividends/carry: Gold ETFs may pay small dividends or distributions and futures entail roll costs; BTC pays none. This affects total return calculations and whether you treat gold as a liability or neutral asset for long holding periods.
Volatility and drawdowns: BTC historically exhibits higher realized volatility and deeper drawdowns. That creates sequencing risk for multi‑year holders and complicates cash‑flow planning for treasuries and pension funds.
Liquidity and market structure: Spot BTC liquidity on major venues is strong for institutional sizes, but there are settlement, custody, and regulatory frictions that differ from the bullion market. For ultra‑large trades, gold’s deep OTC markets still offer a unique liquidity profile.
Transaction costs and slippage: For an allocator adding or trimming positions, execution cost matters. Crypto custody, on‑chain gas, withdrawal limits and exchange counterparty risk are real operational considerations that change the effective return.
Corporate treasuries and demand dynamics
Corporate treasury behavior has altered the effective demand curve for BTC. Companies like MicroStrategy (and related structured financings) have treated BTC as an allocated reserve asset — a tactic documented in recent coverage of corporate playbooks and preferred stock constructs used to finance BTC purchases BeInCrypto. When public companies adopt BTC allocation frameworks, two things happen:
- Demand becomes partially persistent and institutionalized, reducing the pool of freely tradable coins (which can amplify price moves on net flows).
- Treasuries trigger governance and reporting questions that raise the bar for other corporations considering the move; some will mimic, others will wait.
For financial advisors, corporate treasury allocations offer a proof‑point that BTC is being used as a strategic reserve by certain firms — but it is not yet a universal or uniform practice like holding cash or investment‑grade bonds.
Macro scenarios and tail risk: $500k vs $10k
Two high‑profile macro price calls illustrate the breadth of plausible outcomes. Standard Chartered and other institutional bulls have published ultra‑bullish long‑term $500k BTC scenarios based on adoption curves, fixed supply mechanics, and network effects Coinspeaker coverage here. Conversely, a set of macro and commodity strategists have warned of severe downside, with some scenarios revisiting the $10k neighborhood over extended macro stress Finbold examined one such warning.
How should an allocator interpret these competing vistas?
They are not symmetric. A $500k outcome implies a multi‑x upside; a $10k outcome implies a deep contraction. Your allocation should reflect not just expected value but drawdown tolerance and the liquidity needs of the portfolio.
Scenario weighting matters. If you use a two‑state scenario and assign probabilities p (bull) and 1−p (bear), the implied expected return changes dramatically with small shifts in p. This is why many institutions favor small but nontrivial allocations rather than all‑in positions.
Tail hedging. Some allocators explicitly hedge the extreme‑bear case (options, puts, or diversification into uncorrelated assets) if they want exposure to upside while controlling downside risk.
What a $500k or $10k scenario implies for allocations (practical math without presuming a current price)
You can think in multiplicative factors rather than raw dollar targets. Let C be today’s BTC price. A $500k target is a factor of (500k / C); a $10k target is (10k / C). Two practical frameworks to translate those factors into portfolio action:
Risk budgeting: Limit BTC to a % of risk budget (e.g., 1–5% of volatility budget). Because BTC volatility can be 3–6x that of equities, a 1% strategic risk allocation could correspond to a 3–6% notional allocation.
Outcome‑weighted sizing: Choose a probability p for the bullish $500k world. If you want expected terminal exposure of X under both states, solve for weight w that meets w * (500k/C) * p + w * (10k/C) * (1−p) = target terminal exposure. This arithmetic shows how sensitive weights are to p and to the chosen target.
Rules of thumb many advisors use: conservative clients 0–2% BTC, balanced 2–5%, aggressive 5–10% (or higher for tactical sleeves). The exact number should be a function of risk capacity, liquidity needs, and conviction in the probability distribution.
Practical allocation and treasury guidance for long‑term allocators
Favor rule‑based exposure. For both retail and institutional treasuries, define allocation rules: target weight, rebalancing bands, maximum drawdown tolerances, and permitted custody/derivative counterparties.
Use risk‑adjusted performance as a primary lens. Compare Sharpe/Sortino over consistent windows rather than raw annualized numbers. Headline annualized returns (36% vs 16%) may matter for PR but not for prudent portfolio construction.
Small, staged exposures reduce sequencing risk. Dollar‑cost averaging or tranching into an allocation helps mitigate the impact of entering at local peaks.
Consider operational controls. Custody, insurance, accounting treatment, and regulatory reporting should be decided before adding material allocation. The corporate treasury playbook (as seen with MicroStrategy) shows creative financing is possible but also increases complexity BeInCrypto coverage.
Stress test portfolios for both bull and bear extremes. Run scenario analyses that include $500k and $10k paths and check capital adequacy, margining and liquidity under each.
Final verdict: does Bitcoin now trump gold as an institutional store of value?
Short answer: not categorically. Longer, qualified answer:
Bitcoin has outperformed gold over many discrete windows and looks increasingly like a store‑of‑value candidate for institutions that accept high volatility and operational nuance. Saylor’s 36% statement is a defensible headline for specific windows, but it’s not a universal truth across all timeframes or risk metrics (hence Schiff’s counterpoints).
If your mandate is capital growth with a tolerance for large drawdowns, a measured allocation to BTC can improve returns. If your mandate is capital preservation with minimal volatility, gold (or cash/IG bonds) still plays a clearer role.
Institutional adoption and corporate treasury allocations are meaningful structural developments that reduce the purely retail‑driven narrative, but they do not eliminate tail risk. That’s why many advisors favor modest, rule‑based allocations rather than replacing gold wholesale with BTC.
Practical long‑term guidance: use risk‑adjusted frameworks, codify operational rules, stress test for extreme macro scenarios, and keep BTC as part of a diversified toolkit rather than a single answer. For readers building or advising portfolios, tools like Bitlet.app can help manage execution and recurring buy flows in disciplined ways.
Sources
- Cryptopolitan — Saylor’s 36% vs gold discussion: https://www.cryptopolitan.com/bitcoin-annualized-returns-saylor-vs-schiff/
- Cryptopotato — Five‑year performance scorecard and Schiff rebuttal: https://cryptopotato.com/schiff-vs-saylor-the-ultimate-bitcoin-vs-gold-showdown-reignites-on-x/
- Coinspeaker — Standard Chartered $500k Bitcoin price prediction coverage: https://www.coinspeaker.com/standard-chartered-500k-bitcoin-price-prediction/
- Finbold — Commodity strategist bearish $10k scenario coverage: https://finbold.com/commodity-strategist-predict-bitcoin-collapse-to-10000-in-2026/?utm_source=snapi
- BeInCrypto — Corporate treasury and MicroStrategy playbook reporting: https://beincrypto.com/microstrategy-strc-preferred-stock-dat-bitcoin-playbook/