Is Ethereum Completing a Multi‑Year Accumulation? Weekly TA, Derivatives Signals, and a Practical Trade Checklist
Summary
Executive overview
Intermediate traders and portfolio managers debating whether Ethereum accumulation is reaching an end need a framework that blends weekly chart structure, derivatives breadth, and macro liquidity. This article argues that the weekly time frame can be interpreted as a multi‑year accumulation base with a plausible “final shakeout” still in play — but a sustainable breakout will require both price confirmation (the so‑called start engine breakout) and corroborating signals from derivatives and liquidity flows.
Below I lay out the weekly technical read, the key breakout levels (including the widely discussed $2,500 start engine), the derivatives divergence that could precede price strength despite ETF pressure, macro catalysts to watch, and a practical trading checklist (entry, stop, and option hedges) for market participants.
The weekly chart: why this looks like a multi‑year accumulation
Viewed on the weekly timeframe, ETH has spent multiple years forming a broad base with several recognizable characteristics of accumulation: multi‑leg selloffs followed by shallow bounces, progressively tightened ranges, and episodic liquidity flushes that fail to trigger a structural breakdown. This is the classic look of institutions and patient long holders absorbing supply over time rather than capitulating.
Technical commentators who analyze the weekly structure interpret the current weakness not as the start of a new bear market, but as a potential final accumulation stage where remaining weak hands are shaken out. That view is summarized in a recent weekly chart analysis arguing the present down-leg may be the last distribution before a structural reversal (Bitcoinist weekly analysis).
Key weekly measures to read here are: weekly range compression (lower highs and higher lows on multi‑year cycles), declining realized volatility with periodic volatility spikes that coincide with liquidity flushes, and relative strength readings versus both BTC and macro risk assets. For many traders, relative performance against Bitcoin still matters; if ETH can decouple to the upside from BTC on a weekly close above critical levels, that would be meaningful.
The ‘start engine’ level and breakout thresholds
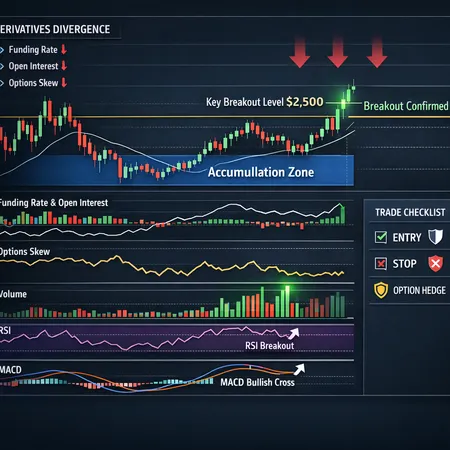
A practical way to convert the weekly narrative into a trade plan is to define objective breakout levels. Several technical commentators have highlighted $2,500 as a pivotal point — a start engine breakout that, if cleared with follow‑through, signals a shift from range accumulation to trending regime (CryptoPotato analysis on the start engine level).
How to treat $2,500 in context:
- A clean weekly close above $2,500 with above‑average weekly volume suggests institutional participation and reduces the probability of a false breakout.
- Confirmation should include a rise in weekly open interest and positive funding rates on perpetuals (moving from neutral/negative toward mildly positive), indicating directional risk is moving back toward buyers.
- Secondary targets after a confirmed breakout would be the prior structural pivots (e.g., $3,200–$3,800 range) while invalidation below weekly support around $1,600–$1,800 would argue the base failed and a deeper correction resumes.
Treat $2,500 as the start engine — not a guaranteed ticket to new highs, but a regime change threshold that materially improves odds for a multi‑month bullish trend.
Derivatives divergence: buyer resilience under ETF pressure
A key nuance in the current market is the divergence between spot/ETF flows and derivative market internals. Spot ETFs and broader retail/ETF flow reporting have shown net outflows or pressure at times, which can push price lower. However, derivatives metrics sometimes tell a different story: open interest, skew, and options flows can reveal that sophisticated buyers are accumulating exposures without pushing immediate spot price.
A recent piece documents a positive derivatives signal for ETH despite pressured ETFs, noting that derivatives markets may be pricing in a different distribution of risk than spot flows imply (CoinTribune derivatives signal). Specific divergences to watch:
- Open interest vs price: rising open interest during price weakness suggests new positions (often longs or hedged structures) are being built rather than simple deleveraging.
- Funding rates and perpetual basis: if funding normalizes from negative to neutral/positive while price remains muted, that signals buyers are willing to pay to hold long exposure.
- Options skew and put/call flow: increased buying of out‑of‑the‑money calls or systematic selling of puts at lower strikes can indicate confident long positioning or structured buy‑side hedging.
When derivatives disagree with ETF pressure, it often means professional desks are creating exposures via swaps and options while ETF creations/redemptions force temporary spot slippage. That divergence can persist for weeks, but when it resolves in favor of derivatives (funding rising, OI expanding), price tends to catch up quickly.
Macro catalysts and liquidity conditions that can tip the scale
Derivatives and technicals operate inside a broader liquidity and macro context. Institutional on‑ramps, broader market liquidity, and macro risk appetite can either amplify an ETH breakout or extend the accumulation. Notable catalysts:
- Broader institutional access and execution: growing retail and institutional access (for example, expanded custodial and brokerage support) increases available liquidity—an important backdrop discussed when mainstream brokers expand crypto services (Coinspeaker on brokerage access). Increased access tends to steepen the rally once confidence returns.
- Macro liquidity (rates, QT/QE): a looser liquidity backdrop or a pause in rate hikes tends to favor risky assets. Conversely, tightening liquidity could delay a breakout or raise the odds of a false break.
- Regulatory clarity and ETF flows: episodic ETF buys or creations can create spot demand; persistent outflows from ETFs, however, are a headwind that derivatives may temporarily absorb.
- On‑chain signals: active development, DeFi growth, and network activity (gas fees, staking inflows) improve the fundamental case and can attract longer‑term buyers.
No single catalyst is decisive alone. A sustainable breakout typically requires a constructive confluence: improved macro liquidity, positive derivatives internals, visible ETF/spot stabilization, and a weekly price confirmation.
Practical trading checklist — entries, stops, and option hedges
This checklist is built for intermediate traders and portfolio managers seeking actionable rules as ETH attempts a regime shift.
- Entry framework
- Tiered entries: scale into exposure rather than a single lump-sum. Consider 25% at pre‑breakout levels (e.g., current range), 50% on a confirmed weekly close above $2,500, and the final 25% on clear follow‑through (weekly close above the next pivot, e.g., $3,200).
- Aggressive entry: intraweek breakout retest of $2,500 with supportive volume can be used by shorter‑term traders; use tighter stops.
- Stop and invalidation
- Primary invalidation: weekly close below $1,600–$1,800 (depending on your risk tolerance) suggests the accumulation failed and larger risk management is required.
- Tactical stop: for each entry tranche, set a stop at a volatility‑adjusted level (e.g., 1.5–2x weekly ATR under your entry). Avoid using stops inside obvious liquidity clusters.
- Position sizing and time horizon
- Tailor position size to the trade horizon. A multi‑month conviction trade after a confirmed weekly breakout can accept a larger size than a near‑term breakout fade.
- Use rolling profit targets: 25–40% of position trimmed at first target (e.g., $3,200) and further trimming into strength.
- Options hedges and structured trades
- Protective puts: buy near‑term ATM or slightly OTM puts (30–90 day) sized to protect a core long. This is simple and effective when implied volatility is relatively cheap.
- Put spreads to reduce hedge cost: buy an OTM put and sell a lower strike put (pay a smaller premium); works if you want downside protection but are willing to accept some downside at extreme levels.
- Call spreads for leveraged bullish exposure: buy a near‑term call and sell a higher strike call (debit spread) to limit cost and define upside risks.
- Volatility plays around catalysts: if you expect a big move but are uncertain of direction, consider a long straddle or strangle around major macro events; but be wary of premium erosion.
- Sell premium carefully: writing premium (naked calls or puts) can be attractive if you expect a prolonged range, but practice prudent margin and collateral management.
- Execution and slippage management
- Use limit orders for large entries to avoid market impact; execute across multiple venues. Tools on platforms like Bitlet.app can help monitor execution costs across order types.
- Monitor funding and basis during execution: derivatives costs can materially affect carry for leveraged positions.
Scenario planning and timeframes
Bull case (higher probability after confirmation): Weekly close > $2,500 + rising open interest and normalized (mildly positive) funding within 2–4 weeks. Expect a multi‑month trend toward prior structure ($3,200–$3,800). Options desks shift from protective hedges to structured call exposure.
Neutral / range case: Repeated failures to hold $2,500 with oscillation between $1,600–$2,800 — derivatives may keep price contained as institutions use swaps to manage exposures and earn yield.
Bear case (invalidates accumulation): Weekly breakdown below $1,600 with fast rises in realized volatility and put buying across expiries; derivatives skew spikes to the downside and funding remains negative, suggesting further capitulation.
Timeframes: weekly confirmation suggests multi‑month trends; intra‑week breakouts need follow‑through on weekly closes to trust the regime change.
Execution checklist for portfolio managers
- Define mandate exposures (size limits, max drawdown); use the trading checklist above to layer exposures.
- Hedge using puts on a percentage of position equal to the risk budget (e.g., hedge 25–50% of spot exposure with 60–90 day puts during uncertain regimes).
- Use overlay strategies: sell covered calls on part of the position after confirmed trend to monetize carry while retaining upside.
- Report monthly attribution: separate returns from directional exposure, volatility harvesting, and structured trades to understand P/L drivers.
Final thoughts and confirmation criteria
Ethereum may well be in the late stages of a multi‑year accumulation cycle, but narrative and structure are not the same as confirmation. For a sustainable breakout you want two corroborating elements: (1) price confirmation — a weekly close above the $2,500 start‑engine level with healthy volume and open interest expansion — and (2) market internals and liquidity confirmation — derivatives skew and funding moving toward buyer-friendly conditions while macro liquidity and ETF flows stabilize.
Watch the divergence between spot/ETF pressure and derivatives as a leading indicator; if derivative metrics resolve in favor of longs, price often follows quickly. Keep position sizing, disciplined stops, and option hedges in place while the market decides.
For traders and PMs building exposure, the roadmap above translates the weekly accumulation thesis into explicit entry, stop, and hedge rules — a practical approach that balances patience with readiness to act when the market hands you the confirmation.
For additional context on macro access and derivatives dynamics, consider reading commentary on institutional brokerage expansion and weekly derivatives reads linked above.
Sources
- Bitcoinist weekly chart analysis arguing current weakness could be the final accumulation: https://bitcoinist.com/ethereum-price-move-to-20000/
- Technical level framing and the $2,500 "start engine" breakout: https://cryptopotato.com/ethereums-eth-next-big-move-hinges-on-this-start-engine-level/
- Analysis of derivatives signals that diverge from ETF pressure: https://cointribune.com/en/ethereum-returns-a-positive-signal-on-derivatives-despite-pressured-etfs/?utm_source=snapi
- Notes on mainstream brokerage access and liquidity implications: https://www.coinspeaker.com/charles-schwab-bitcoin-ethereum-crypto-brokerage-trading/