Bitcoin Derivatives: Why a 50% Open Interest Drop and Wild Funding Rates Signal a Big Move
Summary
Thesis: low open interest plus wild funding = a market primed for a move
Bitcoin markets are not just about spot order books anymore — the derivatives complex now sets the tone for big directional moves. When open interest collapses and funding rates swing between deep negative and large positive values, the market's plumbing changes: less liquidity, concentrated positioning, and amplified liquidation mechanics. That combination often precedes outsized volatility, and right now the derivatives setup for BTC looks like exactly that.
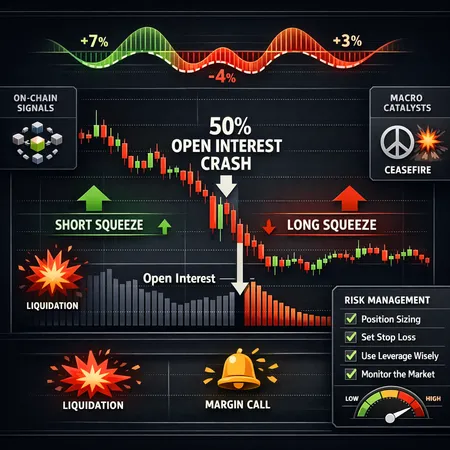
For many traders, Bitcoin remains the primary market bellwether. Recent reporting shows open interest has dropped roughly 50%, a shrinkage that matters for how much leverage the market can sustain before price feedback loops take over (CryptoPotato analysis). At the same time funding rates have swung wildly — reported extremes around -12% to +7% — creating a pendulum of incentive that can suddenly flip the crowded side into a liquidation cascade.
What the ~50% open interest drop actually means
Open interest (OI) measures the aggregate notional of outstanding perpetual and futures contracts. A ~50% drop is not merely a complacent market: it reflects a material unwinding of leveraged positions and a removal of counterparties willing to hold one side of trades.
Mechanically, lower OI leads to three effects:
- Thinner derivatives liquidity: large marketable orders or cascading liquidations now move price further because fewer contracts are outstanding to absorb flow.
- Lower aggregate leverage: the nominal leverage in the system falls, which can reduce the immediate crowding — but it also concentrates remaining risk among fewer, potentially larger, players.
- Increased sensitivity to flows: an exchange or desk liquidation that previously represented 1% of OI may now be 2%+ — a bigger share of the outstanding notional and therefore more price impact.
Put simply: the same sized liquidation or directional flow produces a larger price move than it would have before the OI collapsed.
Funding rates: how -12% to +7% changes incentives and liquidations
Funding rates are the mechanism that keeps perpetual prices tethered to spot. Positive funding means longs pay shorts; negative funding means shorts pay longs. When funding oscillates between extremes like -12% and +7%, the market incentive structure flips dramatically.
What this does practically:
- Crowding builds on the side that receives funding. For example, persistent negative funding (shorts paying longs) implies there are many shorts relative to longs — but shorts are being paid, so the marginal cost of holding a short is actually negative, encouraging more short creation.
- Rapid reversals in funding create a pain point: market participants who flip from receiving to paying must reprice or hedge, often doing so by exiting or flipping positions, which generates flow.
- Exchanges and liquidations are nonlinear. When a funding regime shifts and the crowded side is forced to rebalance, margin calls and forced liquidations can cascade rapidly, especially in a low-OI environment where fewer contracts lie between current price and large stop runs.
Funding extremes of the magnitude reported also distort desk risk models: traditional VaR assumptions break down when funding contributes a large periodic cash flow relative to expected returns.
How low OI + wild funding shapes short- vs. long-squeeze scenarios
Two dominant squeeze narratives emerge when you combine thin OI with volatile funding:
- Short-squeeze (rapid long-runup)
- Setup: Heavy negative funding historically means many shorts were in place and were being paid to hold. If a catalyst forces price up (positive macro surprise or a technical breakout), these shorts have tight stops. In thin OI, covering demand outpaces sell-side depth and price spikes quickly.
- Dynamics: Short covering begets more short covering. Funding flips from negative to positive during a fast rally, meaning longs now pay shorts, but that comes after the squeeze has already been triggered — amplifying the spike.
- Long-squeeze (fast downside)
- Setup: If funding swings positive (longs paying shorts) and a bearish catalyst hits, leveraged long positions that had been paying up to hold exposure can be quickly liquidated. With thin OI, liquidation pressure pushes price lower with less counterflow.
- Dynamics: As price tumbles, forced deleveraging increases supply into an already thin market because counterparties who would normally step in with new leverage have exited earlier during the OI collapse.
Which side is more vulnerable depends on the composition of remaining OI and the most recent funding regime. Because funding has oscillated between large negative and positive values, both sides can look crowded at different moments — and that makes the market vulnerable to whichever catalyst arrives first.
The role of technicals, on-chain, and macro catalysts
Derivatives setups do not exist in a vacuum. Technical structure and macro/on-chain triggers determine which squeeze scenario is more likely.
Technical: Recent chart work shows BTC approaching a multi-month downtrend line where a rejection or breakout is imminent; a decisive break above could ignite a short-squeeze while a clean rejection would fuel a long-squeeze (CryptoDaily analysis). Price action has also shown deviations into bearish behavior during positioning shifts, cautioning traders to expect sloppy moves before clean trends (NewsBTC technical note).
Macro/on-chain catalysts: Items like a surprise ceasefire, big on-chain transfers, or sudden macro-risk repricing can all create directional flows. For example, recent ceasefire-driven price moves demonstrated how quickly risk sentiment can flip and force positioning adjustments in perpetual markets. In a low-OI environment, the same news item that previously moved price 3–4% can now produce 6–8% swings because of the thinner derivatives shell.
Cross-market arbitrage: With fewer derivatives counterparties, opportunistic desks and market makers can widen spreads and step in with larger, asymmetric positions that exacerbate the initial move.
Practical risk-management rules for traders and desks during low-OI regimes
The following are actionable rules tailored for intermediate traders and derivatives desks managing BTC exposure when open interest is low and funding is volatile.
- Reduce target leverage and notional exposure
- Rule: Scale position sizes down in proportion to on-exchange OI relative to a recent baseline (e.g., 30-day average). Practical formula: new_size = baseline_size * (OI_current / OI_30d_avg).
- Example: If OI is 50% of its 30-day average, cut position size to ~50% of your baseline.
- Use wider liquidation cushions and stricter margin buffers
- Rule: Add an extra 1.5–3x buffer to liquidation distance assumptions. If your model assumed a 5% adverse move to liquidation, plan for 7.5–15% when OI is suppressed.
- Stagger entries and exits (laddering)
- Rule: Avoid single large entries. Break positions into 3–5 tranches executed across time and price to avoid being run over by a sudden squeeze.
- Hedge with options or spot when possible
- Rule: Buy out-of-the-money protective options or construct collar strategies instead of relying solely on futures. If options are illiquid, use inverse spot hedges (sell spot to reduce net BTC exposure).
- Monitor funding rate regime and act preemptively
- Rule: When funding pushes into extreme territory (e.g., beyond ±3–4% in an 8‑hour window), assume the crowded side is vulnerable and reduce exposure on that side. When funding oscillates rapidly, widen execution windows and avoid initiating large directional trades.
- Predefine worst-case scenario limits
- Rule: For desks, set hard limits by notional and delta exposure that automatically reduce risk when realized volatility or OI drops below thresholds. Use kill-switches for adverse FX/custody events.
- Expect whipsaw around technical levels
- Rule: Avoid legging into trades right at major downtrend or breakout lines. Use contingent orders that only execute after a clean close beyond the technical level, or reduce size if taking multi-leg positions early.
Position sizing heuristics and a quick checklist
- Heuristic: Target risk per trade as percentage of portfolio (e.g., 0.5–1% equity). Convert that into notional using wider stop distances justified by low-OI regimes.
- Heuristic: For market-making or cross-desk exposure, require a minimum OI threshold before returning to historical notional sizes — e.g., only resume 75% of baseline size when OI recovers above 80% of 30-day average.
Quick pre-trade checklist:
- Check current OI vs 30-day average and apply notional scaling.
- Inspect funding rate trend (8-hour or nearest cadence) and identify which side is receiving funding.
- Confirm technical structure: is BTC at a key downtrend line or support/resistance? (See chart commentary above.)
- Set stop/hedge sized for a wider liquidation cushion.
- Stagger fills and prepare contingency exits.
Final thoughts
A ~50% open interest collapse paired with funding rates swinging between -12% and +7% creates a deceptively calm surface with a volatile undercurrent. Reduced outstanding notional means the market's ability to absorb flows is impaired — and extreme funding regimes bias where squeezes can occur. Combine that environment with a technical inflection point or macro catalyst (news-driven flows, ceasefire headlines, on-chain large transfers) and you have the textbook ingredients for a large move.
This is not a signal to avoid markets entirely; it's a signal to trade differently. Scale down, widen buffers, hedge where appropriate, and treat triggers as potential cascade starters rather than isolated events. Mid-size traders and desks that apply OI-aware sizing and governance — and who keep watch on funding rate flips — will be better positioned to navigate and potentially profit from the coming volatility.
Platforms that simplify position scaling and dollar-cost strategies, like Bitlet.app, can help execution in these regimes but remember: the edge comes from disciplined sizing and strict risk controls, not from chasing squeezes.