Shiba Inu Collapse: Technical Breakdown, Why 93% Fell, and 3 Realistic Recovery Scenarios
Summary
What this investigation covers and why it matters
Shiba Inu (SHIB) isn’t just another ticker: it’s a liquidity-heavy memecoin whose price action often foreshadows broader retail sentiment. Over the last months SHIB slid through long-standing floors and recently broke beneath the $0.000006 level — a technical event that alters likely future paths for price and volatility. For traders this isn’t a theoretical exercise. The difference between a disciplined exit and a hope-driven hold can be tens of percent in P&L.
We’ll first walk through the technical breakdown and on-chain/macro drivers that help explain why SHIB is roughly 93% below its all-time high. Then we’ll model three practical scenarios (bear continuation, prolonged consolidation, tactical recovery) with clear trigger levels, probability ranges, and concrete trade + risk-management protocols for retail participants.
For context, many market observers have flagged the magnitude of SHIB’s fall — and the debate isn’t just academic: it affects liquidity, derivatives funding costs, and how market makers quote sizes across centralized and decentralized venues.
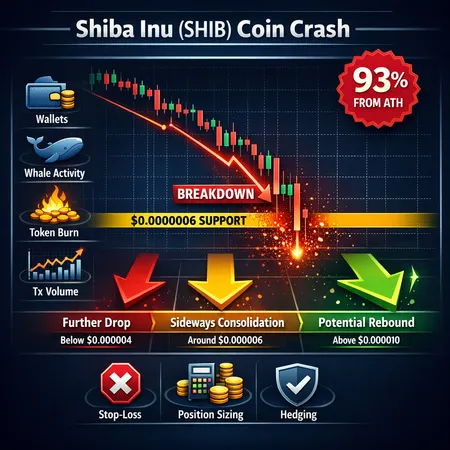
Technical breakdown: the $0.000006 support breach and what it signals
The most immediate technical fact is simple: SHIB slipped decisively beneath the $0.000006 threshold, a level that had functioned as short-term support. Technical analysts flagged this move as significant because once a low-liquidity memecoin loses a psychologically and historically important floor, stop cascades and automated liquidity rebalances often accelerate downside.
A recent technical note lays out the breakdown and outlines three short-term price scenarios after the move beneath $0.000006 — the same framework we expand into longer-horizon planning here (see this technical summary for details). The breach matters for three reasons:
- Loss of confidence: retail buyers who used $0.000006 as a re-entry or stop-loss reference are forced to reassess risk. When retail withdraws, spreads widen and market depth thins.
- Liquidity evaporation: large sell orders or liquidity-provider withdrawals at that band leave fewer resting bids, increasing slippage on any attempt to buy back into the market.
- Volatility regime shift: breaking a well-watched support typically transitions a token from “range-bound retail play” into “trend-following” territory, attracting momentum traders and short sellers.
Technically, the immediate implication is that SHIB must reclaim $0.000006 with convincing volume to reestablish a bullish short-term bias. Otherwise the path of least resistance is lower, where prior micro-supports sit and algorithmic sellers begin to push bids downward.
Macro and on-chain drivers behind the ~93% decline from ATH
A quick headline: the magnitude of the collapse — roughly a 93% drop from peak levels — is not unique among memecoins, but the drivers are multi-layered. An analysis of the price history highlights a combination of speculative mania at the peak, distribution by early large holders, and macro risk-off pressure that sapped marginal buyers (see this analysis for a deeper read).
Key drivers we observe:
Tokenomics and supply pressure: SHIB launched with an extremely large initial supply (1 quadrillion tokens), meaning price moves require massive nominal buying to move the needle. High supply increases sensitivity to token-holder distribution and the impact of even moderate sell pressure. Attempts to use burns and ecosystem incentives have reduced supply slightly, but the core dynamic remains a high floating supply.
Whale distribution and liquidity exits: memecoins often concentrate supply among a small set of wallets early on. Large sell-offs or swap-and-exit events by big holders depress price and create cascades when stop-losses are triggered. On-chain flows during peak-to-decline intervals showed elevated outflows to exchanges and liquidity pools.
Narrative exhaustion and utility gaps: after the initial speculative run, headlines and hype cooled. Without a compelling, consistent utility narrative (or sustained DeFi integration), retail rotates capital elsewhere. This pattern accelerates post-peak when new buyers expect short-term gains and leave when the gains stop. (For those tracking ecosystem activity, NFT and layer-2 narratives — not strictly token utility — often haven’t been sufficient to sustain price.)
Macro risk-off: rising rates and liquidity tightening in broader markets reduce the pool of capital willing to chase speculative assets. When macro starts to turn, the high-beta memecoin cohort tends to underperform.
Putting these together helps explain how a speculative instrument that rallied massively in a risk-on window can lose over 90% when flows reverse — and why that move was reinforced after breaking short-term technical floors.
Scenario analysis: three realistic paths for SHIB (triggers, probabilities, trade ideas)
Below are three concise, disciplined scenario models. Each includes trigger levels you can watch and a sample tactical approach for traders. Probabilities are qualitative estimates for planning, not predictions.
Scenario A — Bear continuation (Probability: 45%)
Trigger levels and dynamics: SHIB fails to reclaim $0.000006 within several daily closes and drops below a secondary support cluster near $0.000004–$0.0000045. Volume on down-days remains higher than on rallies. Liquidity providers widen quotes.
What this means: momentum remains downward; weak hands capitulate and larger holders may re-test liquidity at lower prices. The structural downtrend stays intact until a clear lower low is established and then reversed by a high-volume reclaim.
Practical trade plan:
- If shorting: consider small, staged short positions with tight funding monitoring and hard stop above $0.0000075 to avoid a short-squeeze. Be aware of borrow costs, recalls, and thin liquidity that can spike slippage.
- If holding: reduce position size aggressively using a tiered approach (e.g., sell 25–50% at current levels, more if price breaches $0.0000045).
- Risk rules: max position size 1–2% of portfolio in a trend environment; avoid leverage unless you have strict stop discipline.
Scenario B — Prolonged consolidation (Probability: 35%)
Trigger levels and dynamics: SHIB caps between roughly $0.0000035 and $0.000009 for weeks to months, trading in a wide, low-volume range. On-chain activity is steady but unimpressive; burn programs or ecosystem announcements create temporary pumps but fail to sustain momentum.
What this means: the market is in “waiting” mode. Speculators rotate in and out, but without a clear macro or utility-driven catalyst, SHIB trades sideways. This environment is where mean-reversion, range-bound strategies and liquidity provisioning can work — but risks are high due to potential quick breakouts either way.
Practical trade plan:
- For buyers: consider DCA (dollar-cost averaging) with small tranches rather than lump sums; set a long-term target and explicit loss threshold (e.g., if price breaches the lower range boundary on heavy volume, reassess).
- For liquidity providers: provide narrow exposure in AMM pools with impermanent loss awareness; prefer stable-pair strategies if available.
- Risk rules: keep stop-losses but widen them to avoid getting whipsawed; cap total exposure relative to portfolio volatility — e.g., no more than 3–5% in a memecoin during consolidation.
Scenario C — Tactical recovery / relief rally (Probability: 20%)
Trigger levels and dynamics: a combination of strong on-chain buys, major burn or utility announcement, or a reclaim above $0.000010 with multi-day volume expansion pushes SHIB higher. A reclaim of $0.000012–$0.000015 on above-average volume confirms a tactical trend reversal.
What this means: momentum traders and FOMO-driven retail may return, producing a rapid, but likely short-lived, rally. For real trend change, reclaiming and holding levels well above prior resistance with sustained on-chain activity would be necessary.
Practical trade plan:
- Momentum entries: scale in on conviction after a retest of the breakout level (e.g., buy on pullback to $0.000008–$0.000010 after a confirmed break).
- Profit-taking: set staged profit targets (e.g., 30–50% sold at initial gains, remainder trailed with a moving stop).
- Risk rules: reduce size as volatility spikes and watch for decreasing buy volume and widening spreads as signs of exhaustion.
Tactical signals and what to watch in real time
Monitor these signals to tilt between scenarios:
- Volume profile on reclaim attempts at $0.000006 and $0.000010. Sustained volume is the difference between a real breakout and a dead-cat bounce.
- Exchange inflows/outflows: growing net inflows to exchanges often precede downside; sustained withdrawals to cold wallets reduce sell pressure.
- Whale behavior: unusual wallet movements to exchanges or liquidity pools can presage big moves.
- Derivatives funding and open interest: rising short open interest with negative funding can accelerate squeezes; conversely, rising long open interest with positive funding can fuel rallies.
Also track tokenomics updates (burn programs, new Shibarium integrations, staking or utility launches) because memecoin price action is as much narrative-driven as it is technically driven. For traders who prefer platform context, tools and execution options on services like Bitlet.app may help manage entries and exits without manual slippage errors.
Practical risk-management rules for retail traders (holding or shorting SHIB)
- Position sizing: cap any single memecoin exposure to a small fraction of total capital (suggested 1–5% depending on risk tolerance). High-volatility assets should be fungible only within your speculative sleeve, not core capital.
- Use stop-losses and define them before entering: if you hold, place tiered stops tied to structural levels ($0.0000045 or $0.0000035 for deeper protection). If shorting, set strict loss thresholds and limit leverage.
- Hedging: consider hedging large directional exposure with inverse ETFs where available or short positions in correlated derivatives; remember hedges have costs.
- Avoid or tightly manage leverage: memecoin crashes are fast and can wipe out leveraged positions quickly. If you choose leverage, use micro-sized exposure and hard liquidation buffers.
- Plan exits: predefine profit-taking rules (for instance, take 30–50% off on a 2x move) and trailing stops for the remainder. Don’t leave all decisions to emotion.
- Liquidity awareness: always check order-book depth and slippage at planned entry/exit sizes — a “market order” in low depth can move price against you substantially.
- Short special risks: be ready for borrow recall, sudden short squeezes, and asymmetric losses; never short more than you can cover.
- Mental accounting: treat memecoin allocations as highly speculative “casino” bets — don’t mix them with retirement or emergency funds.
Example trade templates (concise)
- Defensive holder: if below $0.000006, sell 30–50% to reduce exposure; set stop at $0.0000035 and DCA smaller amounts on confirmed lower support.
- Tactical long: buy a starter position only after reclaim of $0.000010 with >50% above-average volume; scale in on pullbacks and sell 40% at first defined target.
- Short scalp: open small, well-collateralized short with stop above $0.0000075; use limit exits and monitor funding rates daily.
Final takeaways for retail traders and strategists
SHIB’s support breakdown below $0.000006 is a clear regime shift: the risk profile increased, liquidity patterns changed, and narrative-driven rallies will now face greater skepticism. The 93% decline from the ATH reflects a classic memecoin lifecycle — rapid speculative inflows followed by distribution and macro tightening — magnified by tokenomics and concentrated supply.
A disciplined plan beats hope. Define which scenario you think is most likely, pick trigger levels above, and stick to predefined risk rules. Whether you’re holding, adding, or shorting SHIB, make your decisions rule-based, size-limited, and hedged where possible.
For traders managing execution and exposure, remember to use reliable APIs and execution platforms — platforms like Bitlet.app are part of the ecosystem used by retail traders to implement the kinds of disciplined plans described here.
Sources
- Coinpedia analysis on Shiba Inu’s price decline and 93% drop from ATH: Shiba Inu price prediction: 2026 — 34B meme coin crash hits SHIB hard
- Technical note on SHIB slipping below $0.000006 with scenario outlines: Shiba Inu loses $0.000006 threshold — three possible price scenarios
Related reading: for broader market context and narrative-driven cross-asset flows see analysis on DeFi and the role of large-cap bellwethers like [Shiba Inu](/en/blog/Shiba Inu) in retail risk appetite.