Altcoin Resilience and ETF Cross-Currents: Why SOL Broke $150 and ADA Flashed a Death Cross
Summary
Executive snapshot
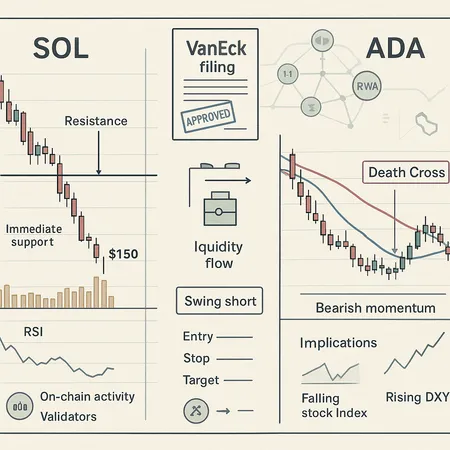
The recent move where SOL dipped under $150 and Cardano printed a classic death cross is not just a textbook technical event. These price actions reflect an interplay of technical setups, measurable on-chain flows, and narrative-driven liquidity rotations — now amplified by VanEck's Solana spot-ETF filing. For swing traders and technical analysts, the key is to read these layers together: charts tell you where the market is vulnerable, on-chain tells you who is moving risk, and ETF-sentiment tells you where new liquidity might arrive or be pulled away from.
Why SOL dropped under $150: technicals and immediate structure
Solana technicals showed a deteriorating structure into the drop. After a multi-week range, breakdown came with rising relative volume and a failure to reclaim the 50-EMA on the daily. That combination often precipitates a quick move to the next visible liquidity cluster.
- Immediate resistance: ~$165–$180 (prior consolidation highs + 50–100 EMA zone). A reclaim of this band with convincing volume would invalidate the near-term bearish bias.
- Immediate support: ~$130–$145 (recent swing lows, high VPVR node). If that band holds, expect mean-reversion attempts toward $160; if it breaks, look to $100–$115 as the larger structural support range.
- Momentum indicators: daily RSI likely showed bearish divergence before the drop; a sub-40 RSI on higher timeframes signals scope for a bounce but not trend reversal.
Why did price actually fall? Three interacting drivers:
- Technical exhaustion: repeated rejections at the 50 DMA and failure to expand into a higher volume area invites stop clusters below the range.
- Short-term on-chain flows: spikes in SOL transfers to centralized exchanges — measured as exchange inflows in the 24–72 hour window — increase available sell-side liquidity and correlate with price drops.
- Narrative rotation: ETF filings (VanEck) and attendant speculation can concentrate flows into SOL while causing other altcoin holders to rebalance, increasing transient selling pressure.
On-chain cues to watch for SOL
When trading breaks, the most useful on-chain signals for short-term setups are:
- Exchange inflows/outflows: rising inflows ahead of and during the drop imply distribution; sustained outflows post-drop indicate accumulation or OTC buyers.
- Active addresses and new-deposit metrics: a sudden drop in active addresses suggests retail disengagement; a pickup in smart contract/deFi interactions can offset pure sell pressure.
- Staking flows and unstaking queues: net unstaking or unbonding can temporarily increase available sell supply.
If you see high exchange inflows + falling active addresses = higher conviction of continuation. If inflows fade and large outflows to cold storage appear, buyers may be stepping in.
ADA death cross: what it means and why context matters
A death cross occurs when a shorter moving average (commonly the 50-day SMA) crosses below a longer one (200-day SMA). For ADA, this is a conspicuous technical-red flag: it encapsulates medium-term bearishness and can trigger algorithmic sell programs and negative positioning from technical funds.
But Cardano is not a vanilla spot coin: its economic model and on-chain structure alter the implications.
- Staking reduces liquid float: ~70–75%+ of ADA can be staked at any time, which mechanically reduces available sell pressure compared with assets that have high circulating free float. That can dampen the amplitude of price declines even when trend indicators turn bearish.
- Sentiment-driven selling vs. structural demand: a death cross tends to affect momentum-focused players first (CTAs, mean-reversion shorts, retail stop-losses). Long-term holders and stakers may remain inert, producing smaller but steadier volume.
- Confirmation matters: a standalone death cross is a lagging signal. It becomes more significant when paired with rising on-chain exchange inflows, negative futures basis (contango in perpetual funding), or a drop in new delegation activity.
Practical implications: expect a higher probability of choppy downside and trend-following stops getting triggered. But because of staking lock-up, outright capitulation may be less severe than the moving averages alone imply.
VanEck's Solana spot-ETF filing: timeline and liquidity mechanics (what traders should parse)
VanEck entering the Solana spot-ETF race is a structural narrative event. Even before approval, filings create a front-running effect: market makers, institutions, and retail re-weight portfolios to anticipate potential inflows.
Timeline considerations (practical framing, not regulatory legal advice):
- Filings typically enter an SEC review window that can span weeks to months. Sponsors often plan marketing and AP (authorized participant) arrangements during this period. Approval is uncertain and can be delayed or conditioned.
- Even without approval, the filing itself often concentrates attention and can tighten spreads as market makers hedge exposure.
How an approved Solana ETF could change liquidity dynamics:
- Net new demand: a spot ETF creates a new on-ramp for capital that does not require custody directly with exchanges; this can increase buy-side pressure for SOL and reduce yield-seeking flows elsewhere.
- Market microstructure: authorized participants will need to source SOL to create ETF shares, potentially pulling large blocks from open market or OTC desks, which can temporarily drain liquidity from smaller altcoins.
- Cross-asset rotation: capital that previously supported memecoins or illiquid DeFi tokens may shift to SOL as an ETF-grade product. That reallocation compresses altcoin depth and can exacerbate volatility in assets like ADA and MATIC.
If VanEck's filing gains traction, watch for sustained positive funding, narrowing spot/perp basis, and concentrated accumulation by APs — those are early signs the ETF is being provisioned in the market.
Macro spillovers and cross-currents between ETFs and altcoins
ETF narratives interact with macro drivers in two ways:
- Risk-on/off amplification: if macro risk-off (rates, USD strength) squeezes leverage, altcoins without ETF narratives (ADA) are more likely to see outsized declines. ETFable assets (SOL) may hold up relatively better due to narrative demand.
- Liquidity recycling: large inflows into an ETF can be financed by selling other positions. In practice, this looks like correlated declines among non-ETF altcoins while SOL (or related liquid pairs) sees reduced sell pressure or even re-accumulation.
Also note cross-protocol effects: Polygon-linked RWA and real-world-asset activity can tilt capital toward MATIC at times, meaning the same liquidity pool that could have supported ADA or smaller DeFi tokens gets redeployed.
Trade-ready scenarios for swing traders
Below are concrete setups that combine technical levels with on-chain filters. Use position sizing and stop rules — target risk per trade 1–3% of portfolio.
- SOL mean-reversion long (lower-risk)
- Trigger: daily candle closes below $150 then reclaims $150 with increased spot volume and falling exchange inflows for 48–72 hours.
- Entry: on reclaim candle close or a confirmed 4H higher-high above the short-term range.
- Stop: below $130 (or below the low of the invalidation candle). Adjust for ATR.
- Targets: partial at $165–$180, full at $200.
- On-chain filter: prefer entries when net exchange flows turn neutral/negative and large wallet accumulation is observed.
- SOL breakout short -> shorts for traders who think ETF hype fades (higher conviction)
- Trigger: fails to clear $180–200 on heavy volume and perps show negative funding spike.
- Entry: short rejection bar or breakdown under $160 with rising exchange inflows.
- Stop: above $200–210.
- Targets: $140, then $115.
- ADA trend-fade short (momentum continuation)
- Trigger: death cross confirmed + daily close below a key support (~recent multi-week low) with rising ADA exchange inflows.
- Entry: short on pullback to former support now resistance (sell the retest) or on breakdown continuation bar.
- Stop: above retest high or 200-day SMA depending on risk tolerance.
- Targets: expect shallow, choppy moves; prefer shorter timeframes and scale out on mean reversion.
- Pair trade (hedged): Long SOL / Short ADA
- Rationale: capture ETF-driven reallocation while hedging general market risk.
- Trigger: divergent on-chain signals (SOL outflows to custody/APs vs ADA inflows to exchanges) and technical divergence where SOL is at support and ADA is breaking down.
- Execution: equal notional sizing; manage rebalancing as ETF news evolves.
Risk management and watchlist items
- Funding rates and futures basis: rising positive funding on SOL suggests leveraged speculative longs — a squeeze environment. Negative funding on ADA can accelerate downside.
- Option skew: put-call skew rising on ADA is a red flag for asymmetric downside demand.
- Regulatory updates: ETF filings can stall. Any SEC clarification, comment letter, or delay is a volatility trigger.
- Staking/unstaking schedules: large unbonding events for ADA or mass unstaking on Solana (if any) are liquidity events.
Also keep an eye on correlated macro drivers: USD index moves, rates, and Bitcoin dominance shifts.
Putting it together: reading the layers
Technical patterns (like SOL breaking $150 or ADA's death cross) give you a decision frame: where stops live, where liquidity clusters sit, and what kind of entries are logical. On-chain data provides the who and how fast — are whales selling into the move, or are retail participants pushing it? ETF filings supply the narrative tailwind or headwind that can redirect capital at scale.
A disciplined swing trader blends these: wait for confirmation on the chart, filter with on-chain flows, and consider the ETF timeline as an evolving liquidity thesis. Platforms that combine execution with on-chain insight — or utilities like Bitlet.app for managing exposures — can help operationalize these plays, but the edge is always in disciplined risk and layered information.
Conclusion
SOL under $150 and ADA's death cross are not isolated technical quirks. They are the visible symptom of deeper liquidity rotations, on-chain movements, and narrative shifts catalyzed by ETF interest from sponsored filings like VanEck's. For swing traders, the path forward is pragmatic: define clear trigger points on the chart, validate with on-chain flow data, and manage trade size against the asymmetric volatility that ETF cross-currents can produce. Stay nimble — the approval timeline and market-makers' hedging behavior will write the next chapters of volatility.