Bitcoin’s Q1 Crash and Gold Rally: Buying Opportunity or Structural Risk?
Summary
Executive snapshot
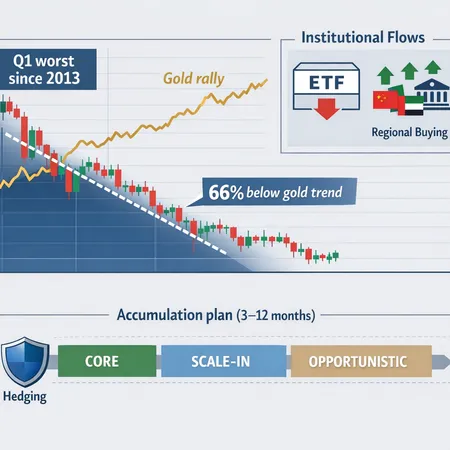
Bitcoin’s Q1 drawdown was severe enough to earn the label “worst Q1 since 2013,” and it arrived while gold staged a rebound that revived narratives of a tight Bitcoin‑gold correlation. That creates a practical question for investors and portfolio managers: do you treat this as a tactical accumulation window or evidence of a deeper structural vulnerability? Below I unpack the drawdown mechanics and historical parallels, evaluate the “66% below gold trend” framework, survey where institutional flows currently sit (ETF redemptions vs regional buyers), and offer a pragmatic accumulation strategy for the next 3–12 months.
What happened in Q1: drawdown mechanics and market plumbing
Q1’s decline was not a single‑factor event. Instead, it reflected a compound of drivers: rapid deleveraging in volatile spots of the market, margin liquidations, cross‑asset risk aversion, and concentrated selling by large holders. Data shows Bitcoin fell roughly 20–25% in the quarter; one analysis framed the move as about a 23% fall and labeled it the worst Q1 since 2013, underlining the magnitude relative to historical seasonal patterns (data report).
Mechanically, the move looked like this: sharp price gaps triggered derivatives liquidations, which cascaded into spot sell pressure as market makers and desks hedged. Liquidity evaporated around key levels, increasing realized volatility and widening bid‑ask spreads. That sequence amplified the drawdown beyond what a pure macro shock might have produced in a more liquid regime.
How this compares to past corrections
Historically, Bitcoin corrections of 20–40% have been common; what stands out about Q1 is timing and correlation with macro — the drawdown arrived alongside renewed appetite for safe havens and a rotation into traditional stores of value. In prior major corrections (2013–2015, 2018), weak on‑chain fundamentals and product failures played larger roles. This time, the underlying network health and adoption metrics are more robust, but macro crosswinds and concentrated flows created similar price outcomes.
A useful lens is to separate magnitude, duration, and catalyst. Magnitude: the Q1 drop fits within long‑run correction envelopes. Duration: this was compact and violent — compression that typically favors staged accumulation rather than panic selling. Catalyst: predominantly macro and liquidity, not systemic on‑chain failure. That nuance matters for deciding buy vs hedge.
Gold rally and the "66% below gold trend" thesis
A provocative corner of the market argues Bitcoin now trades materially below its implied relationship with gold. One piece estimated BTC is roughly 66% undervalued relative to a gold trend line, implying a larger upside if BTC re‑tracks that relationship (analysis).
This framework is appealing because both assets are framed as stores of value; yet its usefulness depends on assumptions: the chosen lookback window, the metric for normalization (market cap vs price), and whether monetary/regime forces that drove the historical relationship still apply. Correlation with gold is real intermittently — especially in risk‑off periods — but it is far from a stable, cointegrated relationship. In some drawdowns BTC behaves more like a speculative risk asset; in others it tracks safe‑haven flows.
Practical takeaway: the 66% figure is a directional signal, not a timing tool. It argues a valuation gap exists if gold keeps rallying and the macro impulse favors stores of value, but it doesn’t rule out further downside if liquidity tightens or risk premia rise.
Where institutional flows actually sit: ETF redemptions vs regional buyers
Institutional flows are important because large, persistent buying or selling can set structural price floors or ceilings. Recent flow data shows a split: while some U.S. funds experienced redemptions and outflows, other regions and buyers stepped in to "buy the dip." Reporting highlights continued outflows in certain U.S. ETFs even as European and other regional participants accumulated (who is buying now).
Why this matters: ETF redemptions in one market can create headline flow‑driven volatility, but cross‑border demand often replenishes bids. Real liquidity depth depends on concentration — a few large sellers can overwhelm many small buyers if timing is clustered. Also note that redemption flows can be self‑reinforcing: poor short‑term performance triggers redemptions which forces selling, which in turn creates more redemptions.
Complementing this, spot market structure shows staged accumulation in the $62k–$71k range, which some analysts read as a consolidation/accumulation zone rather than an immediate breakdown (range analysis). That range gives practical levels for sizing and hedging discussed below.
Scenarios: upside re‑acceleration vs deeper structural risk
Bullish (buy‑the‑dip): Gold continues to rally, liquidity conditions stabilize, and regional/institutional buyers progressively absorb selling. BTC re‑establishes higher lows and resumes trend growth. In this case, buying into staged dips and using modest leverage (if any) can work.
Neutral (prolonged range): The market spends months consolidating in defined bands as macro uncertainty persists. Correlation with gold is patchy; realized volatility remains elevated. Here, staged accumulation with tight sizing is prudent.
Bearish (structural risk): Redemptions cascade, regulatory shocks, or macro tightening causes risk premia to spike and liquidity to dry up, provoking further downside beyond Q1 levels. In this scenario, aggressive buying would be punished; hedges and optionality protect capital.
Which scenario unfolds depends largely on macro liquidity, large account behavior, and central bank policy surprises — not just the BTC‑gold narrative.
A pragmatic 3–12 month accumulation strategy (for intermediate investors and PMs)
Below is a staged, risk‑aware plan designed for those deciding whether to average in or hedge during a macro‑driven crypto drawdown. This is a framework, not investment advice — adapt allocations to risk tolerance, mandate, and liquidity needs.
Position construction and sizing
- Target allocation: define a maximum target weight (e.g., 1–5% of portfolio for conservative, 5–15% for opportunistic allocators). Never exceed the policy cap during an accumulation window.
- Phase buys: divide intended deployment into 4–8 tranches across 3–12 months. Example: 25% at T0, then 12.5% every month for six months until target is reached.
- Size by conviction: allocate slightly more to bids inside the $62k–$71k consolidation band and progressively smaller amounts below each successive support break.
Price triggers and tactical rules
- Primary support band: treat $62k–$71k as a core accumulation zone (per range analyses). Increase cadence inside the band; pause and reassess on close below the band.
- Stop and reassess: if price breaks and closes below a predefined stop threshold (e.g., -20% from entry or below a structural support you set), reduce new buys and consider hedges.
- Volatility sizing: shrink tranche sizes if intraday realized vol spikes above historical norms to avoid poor execution.
Hedging and downside protection
- Options: buy downside protection via puts or put spreads on BTC derivatives if available and cost‑effective. Put spreads cap hedging cost while providing protection for a defined band.
- Short tail risk via futures: for managers with derivative access, consider small inverse futures positions sized to offset tail risk only — not to profit from direction.
- Cash buffer: keep a liquidity buffer (e.g., 5–15% of total mandate) to capitalize on deeper dips without forced selling.
Rebalancing and exit rules
- Time‑based rebalancing: if BTC appreciates beyond target weight by a material margin (e.g., +25% from cost), trim to policy weight.
- Volatility‑based take profits: set partial profit targets at obvious technical levels, and re‑deploy proceeds into hedges or cash.
- Review window: formal reassessment every 30–90 days to re‑evaluate macro regime, correlation with gold, and flow data.
Execution and operational notes
- Avoid market orders in thin liquidity; prefer limit orders or staged VWAP/TWAP execution to reduce slippage.
- Consider platform and counterparty risk: recurring buys and P2P options can help retail execution; for institutional flows, vetted custodians and clearing arrangements matter. If you plan to implement recurring fiat buys, platforms like Bitlet.app can simplify recurring purchases and installment strategies.
Putting the gold correlation into practice
Treat the gold correlation as a macro tilt signal rather than a hard valuation anchor. If gold confirms a sustained rally and real yields keep falling, the macro case for store‑of‑value assets improves — that would lean you toward more aggressive accumulation inside your policy bands. Conversely, if gold rallies on safe‑haven flows while BTC continues to act like a risk asset (falling with equities), the correlation story is weaker and justifies tighter hedges.
Final checklist for decision makers
- Have you defined a clear policy cap for BTC exposure? (Yes → continue; No → set one.)
- Are your tranche sizes tied to objective price bands and volatility metrics? (If not, structure them now.)
- Do you have access to cost‑effective hedges? (Options/futures or cash buffers.)
- Are you monitoring cross‑border institutional flows and ETF redemptions? (These signal where liquidity is coming from or draining to.)
- Is execution planned to minimize slippage and counterparty risk? (Limit orders, vendor checks.)
Conclusion
Q1’s drawdown was large and painful, but historical context and market structure nuance matter. The 66%‑below‑gold trend is an intriguing valuation signal, yet correlation with gold is regime‑dependent and not a timing tool. Current institutional flows show bifurcation — ETF redemptions in some markets alongside regional buyers — which argues for a measured, staged accumulation approach rather than an all‑in bet.
For intermediate investors and portfolio managers, the highest‑probability play is disciplined deployment: predefined caps, phased buys concentrated in identified support bands, optional downside hedges, and operational rigor during execution. That approach balances the opportunity offered by any potential mispricing against the real risk of deeper structural stress.
Sources
- The Currency Analytics — Bitcoin crashes ~23% in worst quarter since 2013: https://thecurrencyanalytics.com/altcoins/bitcoin-crashes-23-in-worst-quarter-since-2013-245543
- Coinpaper — Bitcoin XAU undervalued 66% as gold price reclaims $5,400: https://coinpaper.com/15065/bitcoin-xau-undervalued-66-as-gold-price-reclaims-5-400?utm_source=snapi
- CryptoSlate — Europe buys the dip as US funds keep bleeding: https://cryptoslate.com/europe-buys-the-dip-as-us-funds-keep-bleeding-who-is-buying-bitcoin-right-now/
- CoinPedia — Bitcoin consolidates between $62k and $71k: https://coinpedia.org/price-analysis/bitcoin-consolidates-between-62k-and-71k-accumulation-or-range-trap-before-the-next-move/
For many traders, Bitcoin remains the primary market bellwether, and when investors weigh correlation with Gold they should do so with both humility and a plan.


