Trader’s Guide: Reconciling Saylor, Santiment and Technical Weakness to Spot Real Market Bottoms
Summary
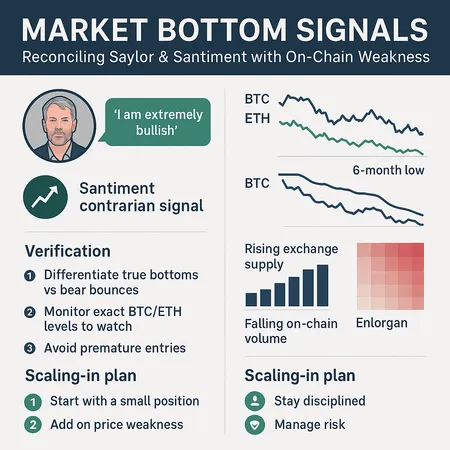
Why mixed signals are the trader’s everyday problem
Markets never hand you a clean verdict. One respected allocators’ public stance can coexist with on-chain metrics that scream caution. For example, Michael Saylor has publicly argued bitcoin has “found its floor” and that much of the liquidation selling is already out of the system, a bullish macro view that suggests accumulation windows are opening (Saylor source). At the same time, sentiment/contrarian indicators highlighted in Tom Lee coverage — e.g., Santiment-style bottom signals — can also imply the market is nearer a local trough if panic is high and position-squaring is complete (Tom Lee / Santiment commentary).
This juxtaposition matters for active traders and portfolio managers. The key is to convert narrative into measurable, repeatable triggers: what exactly would confirm a durable bottom versus a tactical bounce? Below I reconcile the competing signals and give a disciplined checklist plus concrete BTC and ETH levels to monitor.
Reconciling bullish claims and technical/on‑chain weakness
Start by treating each signal as a hypothesis, then test it against market structure and flows. The bullish hypothesis (Saylor) is about structural demand and long-term conviction: if large holders stop selling and accumulation resumes, macro risk-reward improves. The contrarian sentiment signal (Santiment/Tom Lee framing) is an emotional capitulation indicator: extreme pessimism often precedes local lows.
Counterpoints are technical and flow-based. News reports detail Bitcoin trading near recent tight intraday ranges and six‑month lows, which shows price fragility and a lack of follow-through buying (six‑month low coverage). Other pieces note Bitcoin stuck near ~$95k in a tight range, making it vulnerable to a breakdown if leverage or liquidity conditions change (price watch). More technically, analysts have flagged a death cross (shorter MA crossing below longer MA) and rising exchange flows — both classic caution signs for traders (death cross & exchange warning).
The reconciliation is simple in principle: bullish commentary improves your prior, making you more patient and willing to scale in; technical and on‑chain weakness define when not to start scaling and what invalidates your thesis. Use both. Don’t buy headlines. Buy confirmation.
A trader’s mindset when signals conflict
- Treat bullish public views as macro context, not execution triggers. Saylor’s statement raises conviction but doesn’t replace measurable confirmation.
- Treat contrarian sentiment (Santiment-style) as a possible early signal — valuable if backed by flow data and reduced leverage, not just social metrics.
- Let technicals and on‑chain flows set your entry and invalidation rules.
Checklist: differentiate a true bottom from a bear-market bounce
Below are objective, trackable items. Check them off before treating a bounce as a durable buying opportunity.
- Confirmed leverage clean‑up
- Futures open interest down >20% from local peak and funding rates neutral/positive for >5 trading days.
- Exchange supply trend
- Net exchange balances on a 14-day moving average must be flat-to-decreasing (outflows), not spiking inflows. Rising exchange supply is a bearish red flag cited in technical coverage (exchange supply concern).
- Price structure and volatility
- Price must reclaim/hold a meaningful resistance (see exact levels below) with increased daily volume; a low-volume bounce is suspect.
- Moving-average confirmation
- A durable bottom usually shows a daily close above the 50‑DMA and then the 200‑DMA holding as support, or at least a failed retest below the 50‑DMA that quickly recovers.
- Market breadth and derivatives
- Funding rates normalize, basis stabilizes, and option skew eases. Persistently negative funding and widening basis point toward forced selling and are bearish.
- On‑chain accumulation
- Long-term holder supply unchanged or down, and realized losses compressing; new net accumulation by non-exchange addresses is constructive.
- Macro correlation & liquidity
- Risk assets broadly stabilizing (equities, rates) helps. If equities are ripping higher while BTC is at six‑month lows, that decoupling needs explanation and caution (market struggles source).
If you clear 5–6 of these checks, you’re more likely at a real bottom. Clearing only 1–2 suggests a bear-market bounce.
Exact levels to monitor — BTC and ETH (use as objective triggers)
Note: levels are presented as concrete monitoring points you should tie to live price data and the indicators above. Treat them as rules of engagement — not promises. Also: market structure moves; update thresholds to live indices before trading.
BTC (spot) — key levels and what they mean
- Near-term range to watch: $92,000–$98,000. This band reflects the tight trading seen in recent coverage; failure to hold the band often leads to quick downside (price stuck near ~$95k).
- Confirmation of durable bottom: sustained daily close above $115,000 for 7+ trading days with rising 14-day volume and net exchange outflows. This flips tactical bias to constructive.
- Invalidation (deeper bear): close below $78,000 on a daily timeframe and rising exchange inflows, which would suggest the death‑cross story and futures deleveraging is playing out (death cross & warning).
- Tactical bounce that stays a bounce: rally into resistance at $105,000–$112,000 but fails to break and closes back under $98,000 within 5 trading days.
ETH (spot) — key levels and what they mean
- Near-term pivot band: $3,700–$4,300 — use this as your intraday/weekly risk zone for ETH; breakdown below this amplifies ETH-beta to BTC weakness.
- Confirmation of durable bottom: daily close > $5,000 for 7+ trading days with improving on-chain transfer volumes to non-exchange addresses and lower staking outflows.
- Invalidation (deeper bear): close below $3,200 accompanied by spike in exchange-deposited ETH and worsening derivatives skew.
Relative checks
- ETH/BTC ratio: a durable bottom often shows ETH stabilizing relative to BTC. Watch ETH/BTC reclaiming 0.038–0.040 for signs of ETH-led recovery.
A quick word on timeframes: use daily closes for confirmation and 4‑hour or 1‑hour charts for entry execution and tighter stops.
4-step scaling-in plan for long-bias managers
This is a disciplined, capital-efficient framework for managers who want to add exposure while respecting the possibility of further downside.
Phase 0 — Watch & size plan (pre-execution)
- Allocate a maximum target (e.g., 5–10% of portfolio to spot crypto or desired BTC/ETH split) and prespecify batch sizes. Decide maximum per-trade slippage and the overall scaling timeframe (4–12 weeks).
- Do not execute until at least 2–3 items from the checklist show constructive movement (e.g., funding neutral, exchange outflows, and volume confirmation).
Phase 1 — Opportunistic seed (20% of target allocation)
- Trigger: a low-volume washout with bullish contrarian signals (Santiment extremes) and realized funding normalization for 48–72 hours.
- Place a small buy sized at 20% of final target. Set a stop at 8–12% below entry (or use a time-based re-evaluation after 10 trading days). This seed is a probe, not full conviction.
Phase 2 — Confirmation add (30–40% of target)
- Trigger: price holds above your initial seed buy and shows the first technical confirmation (e.g., reclaim of 50‑DMA or a convincing break of the near-term resistance band). Also require at least one on‑chain positive (net exchange outflows or steady long‑term holder accumulation).
- Add 30–40% of target allocation. Move initial stop to breakeven or trail below a structure low.
Phase 3 — Momentum/Full allocation (remaining 40–50%)
- Trigger: multi-day confirmation — sustained closes above larger resistance (e.g., BTC daily close > $115k or ETH > $5k as noted) with rising volume and normalized derivatives.
- Complete sizing. Consider hedges (protective puts) for interim downside or to lock in cost basis if options pricing is favorable.
Practical sizing example: target 6% portfolio to BTC — seed 1.2% (20%), add 1.8–2.4% (30–40%), final 2.4–3.0% (remaining). Adjust sizes to your mandate and liquidity needs.
Stop, hedge, and monitor
- Always predefine invalidation: if BTC closes below $78k (or ETH below $3,200) with corroborating flow data, reduce exposure by at least one tranche and reassess.
- Use hedges sparingly: short-dated puts to protect large increments during phase 3 are reasonable; avoid heavy short positions that eat carry.
Execution nuances and trade management
- Stagger reconciliations across venue liquidity. Executing large baskets on a single orderbook invites slippage; use TWAP / VWAP execution tools.
- Prefer OTC for blocks to avoid market impact. Bitlet.app users can pair installment approaches with on‑chain accumulation strategies rather than lumped bets.
- Rebalance — after substantial rallies, trim position to pre-specified profit-taking bands (e.g., trim 20% at +30% unrealized gain, hedge another 20% with options).
Quick checklist cheat-sheet (printable)
- Funding rates back to neutral for 48–72 hrs — yes/no
- Futures open interest down >20% from peak — yes/no
- Exchange balances showing net outflow 14d MA — yes/no
- Daily close above local 50‑DMA and momentum confirmed by volume — yes/no
- On‑chain long-term holder supply steady or increasing — yes/no
- Option skew and basis stabilizing — yes/no
If at least 4 out of 6 are yes → consider phased buying per scaling plan. If 2 or fewer → treat moves as tactical bounces.
Final takeaways and risk reminder
Narrative matters, but it must be anchored to flows and structure. Michael Saylor’s floor argument and Santiment-style contrarian signals are useful context — they should make you patient and attentive to accumulation windows. But the death cross, six‑month lows, rising exchange supply and other technicals provide execution discipline: they tell you when to hold off and when to reduce size.
This guide gives concrete levels, objective checklist items and a 4-step scaling-in plan to help managers convert uncertainty into a repeatable playbook. Markets change; update the exact numbers to live feeds before trading, and always size positions to mandate and liquidity. Not financial advice — this is a tactical, risk‑first framework to help you decide whether a market bottom is real or merely another bear-market bounce.


