Bitcoin's $90K Make-or-Break: Technicals, ETF Outflows, Macro Catalysts and Trade Plans
Summary
Context: Why $90K matters now
Bitcoin's price action in early 2026 feels less like linear momentum and more like a precision test of market structure. The $85k–$95k band has been the market's decision region: sellers are defending the top of the range while buyers pick their spots nearer the bottom. That band is not just a round-number curiosity — it's where liquidity clusters, options expiries often sit, and where ETF flows have recently changed the sign of institutional participation.
For many traders, Bitcoin remains the primary market bellwether; when BTC steadies or breaks decisively, it cascades into altcoins, derivatives desks and larger risk assets. Understanding the technicals, orderflow, and macro catalysts working through this $90k support zone is essential before algorithmic or discretionary exposure is increased.
Technical structure and key levels
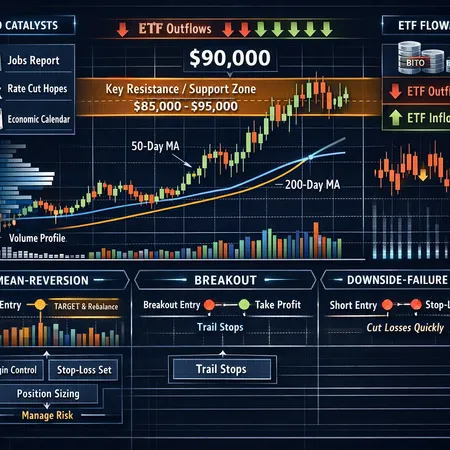
Price action through February–March 2026 shows a clear horizontal battlefield.
- Key support zone: $85,000–$88,500 — multiple daily candles found buyers here; stop clusters and leverage sweat bands concentrate just below.
- Near-term pivot / fair-value: $90,000 — psychological and options-heavy level; traders treat it as a magnet for mean reversion and breakout verification.
- Resistance cluster: $92,500–$95,000 — prior swing highs, large ask walls on visible orderbooks, and the upper edge of the consolidation range.
On the chart, expect reduced directional conviction within the band: range trades, short gamma from large options positions, and frequent false breakouts. Volume profile shows value concentrated between $88k–$92k; moves that quickly depart that value with conviction and rising volume are the ones to respect.
Technical cues to watch (order of importance):
- Volume-weighted confirmation — a breakout or breakdown with sustained volume above the 20-day mean.
- Depth and iceberg behavior on the orderbook — persistent hidden liquidity or any large resting bids/asks.
- Options skew and open interest shifts — expiries concentrated around $90k will amplify pinning or forced delta flows.
ETF flows, orderflow interpretation and what outflows mean
Spot-Bitcoin ETF dynamics have been a dominant macro-structural factor across 2025–26. Recent reporting shows an early-2026 rotation into cash — the spot instruments experienced notable redemptions. Cointelegraph documented that spot Bitcoin ETFs lost about $681M in their first week of 2026, a clear sign of short-term risk-off positioning among some holders (this is not guaranteed long-term capitulation) spot ETF outflows and risk-off.
CoinTribune also highlights that ETF support has weakened as BTC hovers near $90k, implying institutions are willing to step back unless trend clarity returns: ETF support weakens.
What do successive ETF outflows mean operationally for orderflow?
- Reduced persistent bid: When ETFs are net buyers, they provide a steady baseline demand; outflows remove that layer, letting downside liquidity gaps widen.
- Higher sensitivity to macro news: With institutional passive demand reduced, price becomes more driven by discretionary flows and macro catalysts (jobs, rate expectations). Expect larger one-way moves on macro prints.
- Delta-hedging and forced selling: If outflows coincide with put-heavy protection buying that expires or rebalances, desks can be forced to sell spot to hedge, accentuating down moves.
The practical conclusion: ETF outflows increase the probability of quick decompressions below established supports and make mean-reversion plays more attractive but riskier because of fat-tail downside events.
Macro catalysts shaping positioning
The recent U.S. jobs report illustrated how sensitive BTC has become to macro prints. TheCurrencyAnalytics noted Bitcoin steadied above $90k after a jobs report release, showing that labor markets and rate-path expectations still matter for crypto jobs report steadying BTC. Meanwhile, price analyses framing the consolidation zone underline a make-or-break moment between $85k–$95k as traders price in different narratives for monetary policy price analysis on pivotal zone.
How macro facts affect positioning:
- Stronger-than-expected jobs / higher yields = reduced risk appetite, equities and BTC pressured; flows tilt to outflows from risk assets and ETFs.
- Weaker jobs / earlier rate cuts priced = improved risk-on, potential re-acceleration into BTC spot and derivatives; however, positioning may need to clear short-term overhang from prior outflows.
- Volatility regime shifts = affects options skew, funding rates, and willingness to provide liquidity in derivatives markets.
Macro is not binary. The market is currently oscillating between a Fear-of-Missing-Out (FOMO) narrative for buyers waiting for the next leg higher and a risk-management narrative from institutions unwilling to add until clarity on rate cuts appears. That ambiguity is the core reason the $90k support is a make-or-break area.
Scenario-based trade plans (actionable)
Below are three actionable setups for intermediate-to-advanced traders. Each plan includes entry, target, stop guidance and notes on orderflow context.
1) Mean-reversion (range trade)
- Thesis: BTC stays inside $85k–$95k and returns to the mean near $90k. Outflows have increased volatility but not yet removed the range.
- Entry: Buy near $86k–$88k on 4H confirmation (bullish wick rejection, falling on lower volume). Consider scaling in 30/30/40.
- Target: $91k–$93k for partial take-profit; trail remainder toward $95k if volume expands.
- Stop: 3–5% below the lowest buy (tighten if funding spikes negative). If price breaches $85k decisively with rising volume, exit — that violates the range.
- Position sizing: Keep leveraged exposure conservative (<=3x on perpetuals; <=10% nominal on margin). Lower leverage given ETF outflows.
- Execution nuance: Use TWAP or iceberg orders to avoid alerting liquidity providers. Monitor options expiry clusters that could pin price.
2) Breakout to the upside (trend-follow)
- Thesis: Macro loosening expectations or a washout of selling leads to ETF flow reversal or new buyers stepping in; breakout above $95k signals structural continuation.
- Entry: Enter on candle close above $95k with volume > 20-day average. Aggressive traders can ladder above $92.5k with protective stops.
- Target: First objective $105k, then $120k as a measured move (weekly structure projection).
- Stop: Below breakout retest or below $92k depending on entry. Use percentage stops for derivatives with awareness of funding.
- Sizing: Gradually increase exposure as breakout confirms across timeframes. Use options (call spreads) to express asymmetric upside with defined risk.
- Orderflow watch: Look for ETF inflows reversing outflows and sustained delta buying from desks. Monitor funding rates to avoid being long into adverse funding spikes.
3) Downside failure (breakdown / short)
- Thesis: ETF outflows combine with weak macro (stronger jobs/higher yields) and price breaks $85k with momentum; short gamma and forced liquidation amplify the drop.
- Entry: Short on confirmed breakdown below $85k with increasing volume and open interest rising on shorts. Consider a two-part entry: partial at breakdown, add on a failed retest.
- Target: $75k initial target, $65k secondary if liquidation clusters and options skew blow out.
- Stop: If price recovers above $88k on high volume, close—this suggests a false breakdown.
- Risk controls: Avoid maximum leverage. Derivatives traders should set self-liquidation buffers and maintain margin above required to prevent exchange liquidations.
- Hedging: Buy protective puts or use options strategies to cap tail risk.
Derivatives-specific risk management (practical rules)
Derivatives amplify both opportunity and risk. Given the current flow environment, adopt stricter rules than in calmer regimes:
- Leverage caps: Max 3x on perpetuals for directional swings inside the range; maximum 2x for overnight exposure if macro prints are expected.
- Position sizing: Risk no more than 1–2% of account equity per trade (realized P&L risk), and concentrate hedges if exposures approach 5% total portfolio risk.
- Stop discipline: Use bracket orders where possible. Size stops to avoid getting picked off by micro-liquidity moves but strict enough to prevent cascade drawdowns.
- Funding and expiry awareness: Check funding rates hourly if using perpetuals; roll options before vol spikes or before major macro events. High negative funding while long is a tax on position — consider hedging or switching to spot if costly.
- Cross-margin and portfolio-level checks: Avoid concentrated cross-margined exposures across multiple exchanges where a single funding squeeze can liquidate correlated positions.
- Stress testing: Run a simple liquidation scenario: what happens to P&L if BTC gaps 10% lower and funding doubles for 48 hours? Predefine actions (reduce leverage, close half exposure).
Execution checklist and monitoring
Before deploying capital, run this checklist:
- Confirm the technical trigger (close beyond level + volume confirmation).
- Assess ETF flow headlines and recent daily ETF net flows.
- Digest latest macro prints (jobs, CPI, minutes) and rate-path implied by swaps.
- Check derivatives metrics: funding, open interest, skew, and largest expiries.
- Pre-set stops and have a clear liquidation threshold.
- Use staggered entries and automated orders to limit slippage.
For live monitoring, track exchange orderbooks, options expiries and funding rates hourly. Tools and platforms (including Bitlet.app) can surface live flow snapshots to help coordinate execution across spot and derivatives.
Practical examples (mini case studies)
Example A (mean reversion win): A trader buys $87k with a 3% stop. Price wicks to $85.5k but buys quickly; the trade is scaled out into $91.5k and the trader records a 6% gain while keeping risk small.
Example B (breakout fade gone wrong): A momentum trader chases a weak break to $96k with high leverage; lack of follow-through and an ETF outflow headline push price back under $92k, triggering a liquidation — lesson: wait for volume confirmation or hedge with options.
Conclusion: Asymmetric preparation wins
Bitcoin's $90k make-or-break moment is less about a single print and more about how macro catalysts, ETF flows and microstructure interact. With spot ETF outflows removing a reliable bid, downside tail risk rose; but that also means asymmetric opportunities exist for disciplined traders who combine technicals with orderflow and macro context.
Trade plans should be scenario-based, risk-managed, and dynamically adjusted as flows and macro signals change. Keep leverage conservative, respect stop discipline, and treat options as useful hedges to avoid catastrophic derivatives losses.
Sources