Solana’s Pricing Disconnect: Why SOL’s On‑Chain Strength and ETF Staking Aren’t Stopping the Slide
Summary
Executive snapshot
Solana’s token, SOL, has faced a pronounced drawdown that looks disconnected from several positive on‑chain metrics: high throughput, low fees, and active developer activity. At the same time, the rise of ETF staking products—where funds distribute staking proceeds back to investors—adds a new flow into the SOL market that many expect could buoy demand. But do staking proceeds and ETF mechanics meaningfully change the supply/demand balance? Or are these yield flows simply marginal relative to macro and technical pressure? This article walks through the evidence and offers trading scenarios for DeFi traders and on‑chain analysts.
How deep is the Solana decline — and what technicals are saying?
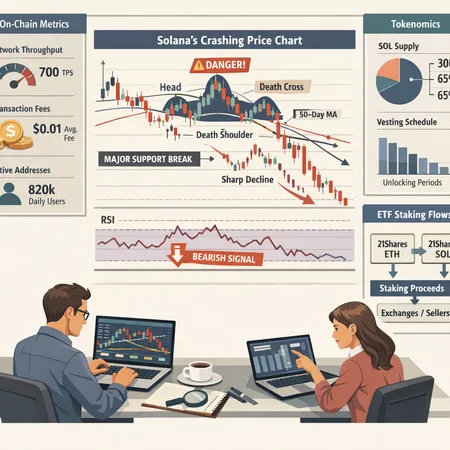
SOL’s drawdown has been sharp and, in places, structurally meaningful. Technical analysts have flagged patterns consistent with long unwind and distribution; one recent technical take argued SOL could face drawdowns of this magnitude and signaled potential for further downside Blockonomi’s analysis. That piece highlights high‑probability breakdowns from multi‑year ranges and momentum exhaustion.
Complementing that view, market coverage noted SOL’s extension of the slide amid risk‑off catalysts and ETF/futures flows, with derivatives positioning and ETF-linked product dynamics amplifying price pressure in certain windows TokenPost coverage. The takeaway for traders: technical structure is not healed—key support levels were broken and that invites mean reversion attempts but also leaves room for further downside if liquidity dries up.
On‑chain fundamentals: throughput, fees, and activity vs price action
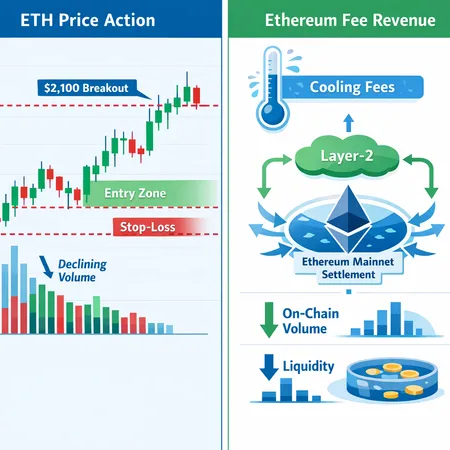
On‑chain metrics paint a more bullish usability picture. Solana’s architecture emphasizes high throughput and low transaction fees, which supports high‑frequency applications and cost‑sensitive primitives. The comparison between ETH and SOL frequently surfaces in this context: Ethereum still monetizes higher‑value settlement activity and captures two‑sided fee economics, while Solana optimizes for throughput and low per‑tx cost TokenPost comparison.
Key on‑chain observations:
- Throughput: Solana sustains far higher transactions per second than many competitors, which enables gaming, bots, and micro‑fee apps to thrive.
- Fees: Low fees keep user friction minimal and drive activity, but they also mean the protocol captures less fee revenue per unit of economic activity compared with Ethereum.
- Developer & dApp activity: Active programs and NFT/DEX usage remain meaningful even during price drops; usage isn’t always tightly coupled to token price.
This decoupling—high utility but collapsing price—has precedent in crypto, especially where narratives (security, long‑term decentralization, staking economics) and macro liquidity dominate trader behavior. For many traders, Bitcoin still sets macro risk tone, but chain‑specific narratives move on their own timetable.
ETF staking products and the mechanics of staking proceeds
ETF staking products change how staking rewards enter capital markets. Funds that offer tokenized ETFs with staking exposure will collect rewards and periodically distribute them to shareholders as staking proceeds. A real‑world example: 21Shares reported distributing staking proceeds for ETH and SOL ETFs, making staking yield a visible flow coming out of the product wrapper and into investor wallets or custodial accounts 21Shares report.
Mechanically, there are three relevant channels:
- Direct distribution to holders: ETF vehicles remit staking income, increasing liquidity pressure if recipients sell.
- Reinvestment by funds: Funds can compound rewards, reducing immediate selling but increasing future supply if funds rebalance.
- Retail & institutional behavior: Recipients may prefer yield over price exposure or vice versa; selling preferences matter.
Because staking yields are recurring, the market often treats them like a modest continuous supply of newly liquid tokens. Whether that supply meaningfully impacts price depends on the scale of distributed proceeds relative to available bids.
Can staking proceeds shore up demand for SOL? A flow‑based assessment
It’s tempting to assume steady staking payouts act like a natural bid: regular yield equals predictable demand. In practice, the net effect depends on magnitude and net behavior:
Scale: ETF staking proceeds reported by managers are real but often small relative to total market cap and daily traded volumes. For SOL to be materially supported, staking distributions need to exceed—or at least match—the magnitude of selling pressure from weak holders, derivatives deleveraging, or macro risk aversion. Current public reports signal flow, but not necessarily at that scale 21Shares report.
Buyer versus seller behavior: If recipients of staking payouts are primarily yield‑hungry holders who re‑stake or hold, the net effect can be stabilizing. Conversely, if payouts are sold to realize cash, the distributions add to supply pressure.
Timing and predictability: ETF distributions are scheduled and public; that predictability can be front‑run by traders and turned into tactical selling or buy‑the‑dip strategies, reducing their stabilizing power.
Comparative monetization (ETH vs SOL): Ethereum’s settlement value and broader fee capture mean ETH staking flows interact with a different demand base (settlement and L2 economics) than Solana’s throughput‑driven ecosystem. That distinction matters: ETH staking rewards may be absorbed differently than SOL rewards given differences in holders and use cases TokenPost comparison.
In short: ETF staking proceeds help, but they are not a panacea. They provide steady, visible inflows that can improve liquidity structure over time—but in the face of concentrated selling or macro deleveraging, they are unlikely to fully absorb price pressure.
Tokenomics and where selling pressure originates
Understanding tokenomics clarifies who sells when. Major pressure points include:
- Unstaking and lockup expiries: Large holders unlocking tokens create potential supply spikes.
- Derivatives liquidations: Volatility‑driven margin calls force sales regardless of on‑chain fundamentals.
- ETF rebalancing and creations/redemptions: Arbitrage and rebalancing mechanics can create temporary sell pressure.
SOL’s staking model and inflation schedule determine how many tokens enter circulation via rewards. If staking yields plus validator rewards are high enough, they can dilute holders over time—requiring consistent demand to maintain price. But token flow alone doesn't capture sentiment; liquidity structure, exchange custody concentrations, and macro conditions are equally important.
Trading scenarios: mean reversion, volatility plays, and hedges
For traders assessing opportunities, here are concrete scenarios and setups calibrated to the current disconnect.
Scenario A — Tactical mean reversion (time horizon: days–weeks)
- Rationale: Price overshoot due to liquidation or technical breakdown; on‑chain activity signals underlying usage.
- Setup: Scale into long using laddered limit buys near structurally important on‑chain‑informed support (e.g., previous accumulation nodes identified by volume‑profile). Use tight stops below confirmed breakdowns.
- Risk management: Size position so a re‑test to lower technical targets (per Blockonomi’s downside scenarios) is acceptable. Consider pairing with on‑chain signals (active addresses, fee spikes) as stop‑loss triggers.
Scenario B — Volatility arbitrage (time horizon: weeks)
- Rationale: Market prices in too much or too little realized volatility; earnings from theta if implied vol is rich.
- Setup: Sell premium via calendar spreads or iron condors around high implied vol windows if you expect rangebound action. Alternatively, buy straddles if you expect event‑driven spikes.
- Execution nuance: Liquidity in SOL options can be shallow; prefer spreads to reduce gamma risk. Hedge directional exposure with futures or inverse ETFs.
Scenario C — Yield capture + hedge (time horizon: months)
- Rationale: Capture staking yield flows while protecting downside.
- Setup: Accumulate a core position via dollar‑cost averaging, claim/receive staking proceeds and simultaneously buy protective puts or structure a collar to cap downside while giving up some upside.
- Practical note: If using ETF staking products, understand distribution cadence and potential tax/operational frictions. Bitlet.app users often combine yield products with tactical hedges—do the math on net yield after hedge costs.
Scenario D — Short bias with liquidity target (time horizon: event driven)
- Rationale: Technical patterns point to further downside; derivatives skew and funding rates signal short‑friendly conditions.
- Setup: Use futures or borrow/lend markets for shorts, ensure you have a liquidity target (take profits near known liquidity pools). Keep position size limited against potential squeezes.
Execution, slippage and market microstructure considerations
Practical execution matters as much as thesis. SOL’s on‑chain activity can mislead traders about off‑chain liquidity: a bustling DEX might not translate to deep order books on major centralized exchanges during stress. Watch for:
- Exchange order book depth and bid‑ask spreads.
- Funding rates and open interest in perpetual futures as a short/long signal.
- Timing ETF distribution dates (quarterly/monthly) when payouts might create intraday selling.
Also monitor on‑chain metrics like active addresses and token flow to exchanges to detect when staking proceeds are being offloaded.
What would change the thesis? Key catalysts to watch
Positive catalysts that would close the disconnect:
- Meaningful inflows into SOL‑linked ETFs and custody products that lock tokens.
- A sustained shift in buyer composition where staking receipts are held rather than sold.
- Macro liquidity returning and easing derivatives deleveraging.
Negative catalysts that deepen the disconnect:
- Large validators or funds liquidating tokens rapidly.
- Technical breakdowns leading to cascading liquidations (as highlighted by recent analyses) Blockonomi.
Conclusion: measured optimism with active risk controls
Solana’s situation is nuanced. On‑chain fundamentals—throughput, low fees, and active usage—support a long‑term narrative for SOL, but price is sensitive to macro, derivatives, and technical structure. ETF staking distributions like those reported by 21Shares add a visible yield flow, yet their scale and recipient behavior limit their ability to fully absorb selling pressure in stressed environments 21Shares report.
For DeFi traders and on‑chain analysts, the prudent approach is scenario‑based: if you’re running mean‑reversion bets, size conservatively and use on‑chain signals as conviction adders; if trading volatility, prioritize spreads and liquidity awareness. Remember the ETH vs SOL dynamic—monetization sources differ, and so will the market’s appetite for distributed staking proceeds TokenPost comparison.
Finally, position management and execution planning are the differentiators. Whether staking yields eventually shore up SOL depends less on the presence of staking and more on how recipients (and large holders) behave. If you’re trading SOL, pair your chain analysis with derivative market reads and platform execution checks—Bitlet.app and other execution venues can help with order routing and hedges, but the thesis must come from this layered analysis.
Sources
- 21Shares staking proceeds report: https://coincu.com/news/21shares-eth-sol-etf-staking-proceeds-march-31/?utm_source=snapi
- Blockonomi technical analysis on SOL downside: https://blockonomi.com/solana-sol-faces-77-decline-as-technical-patterns-signal-potential-drop-to-60/
- TokenPost coverage: SOL slide and ETF/futures dynamics: https://www.tokenpost.com/news/investing/19385
- TokenPost comparison: ETH monetizes settlement while SOL emphasizes throughput: https://www.tokenpost.com/news/insights/19394