How ETF Flows, Fee Compression and On‑Chain Supply Are Rewriting BTC Price Dynamics in Q1 2026
Summary
Executive snapshot
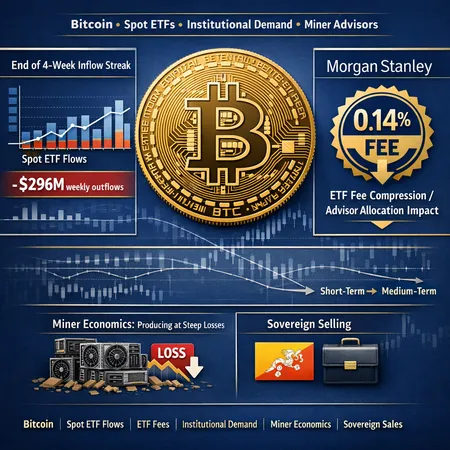
Q1 2026 was a reality check for anyone assuming the ETF era would automatically translate into uninterrupted upward pressure on BTC. A four‑week inflow streak into spot ETFs ended as managers recorded roughly $296 million of weekly outflows, a sign that liquidity is more fickle than the headlines suggested. Meanwhile, fee competition moved front and center when Morgan Stanley proposed an ultra‑low 0.14% spot Bitcoin ETF—an aggressive product designed to steal market share by lowering the cost barrier for advised allocation. At the same time, on‑chain supply moved in ways that add genuine selling pressure: sovereign sellers (notably Bhutan) and miners producing at severe losses are dislodging coins into the market.
For many traders and allocators, Bitcoin remains the primary bellwether. But the interplay of ETF flows, fee compression and persistent supply-side selling—against a backdrop of changing rate expectations—creates a new market structure that institutional investors and advisors must parse carefully.
Spot ETF flows: the end of the streak and why $296M matters
The narrative that ETFs would magically soak up incremental BTC supply and smooth volatility ran into a reality check in Q1. After consecutive inflow weeks, spot ETFs reversed course with a notable outflow week of approximately $296M. This isn’t just a headline number: flows at this scale change near‑term liquidity, affect bid depth on primary venues, and can force rebalances in model portfolios that assumed persistent ETF demand (source: Cointelegraph).
Why it matters to institutions:
- ETFs concentrate custodial holdings and create on‑ramp flexibility, but they also introduce a single point of demand that can reverse quickly. When flows flip, price impact can be amplified because ETF creation/redemption mechanics and broker/dealer hedges require liquidity to unwind.
- $296M in outflows in one week decompresses realized liquidity; trading desks need to cover delta and cushioned positions, creating short‑term directional risk.
Net takeaway: flow volatility is the new normal even in the ETF era. Advisors should stop treating ETF inflows as a perpetual backstop and begin building scenarios for both sustained inflows and rapid reversals.
Fee competition and the Morgan Stanley 0.14% play: implications for advisor allocation
What fee compression means
Lower fees have a direct, measurable effect on long‑term returns. A 0.14% annual fee versus, say, 0.75% compounds into several basis points of performance drag over multi‑year horizons—enough to materially change an advisor’s model allocation, especially inside fee‑sensitive retail and intermediary channels.
Morgan Stanley's proposed ultra‑low 0.14% spot Bitcoin ETF is explicitly positioned to challenge incumbents on cost and win share among advisors and wealth platforms (source: Blockonomi). That creates two important dynamics:
- Lower fees can broaden adoption by reducing the "friction tax" on allocations for conservative clients and model portfolios.
- Fee compression intensifies competition on non‑price dimensions—like custody reliability, settlement efficiency, broker support, and trading liquidity—which may favor larger managers despite smaller fees.
What advisors should think about
- Total cost vs. operational risk: A cheaper ETF lowers drag, but advisors must weigh the counterfactual—does the provider have the clearing and market‑making relationships to ensure tight spreads during stress? Cost alone isn’t the whole decision.
- Concentration and liquidity: If cheaper ETFs attract fast money, flows may become more procyclical. An advisor who tilts models to the lowest fee ETF could find client NAVs more sensitive to redemption waves.
- Client segmentation: For long‑term buy‑and‑hold clients, fee savings compound. For clients with higher liquidity needs or tactical mandates, execution quality and bid/ask spread may trump a few basis points of fee savings.
Lower fees are good for adoption, but they also change the composition and tempo of flows—making the ETF market more competitive, but not necessarily more stable.
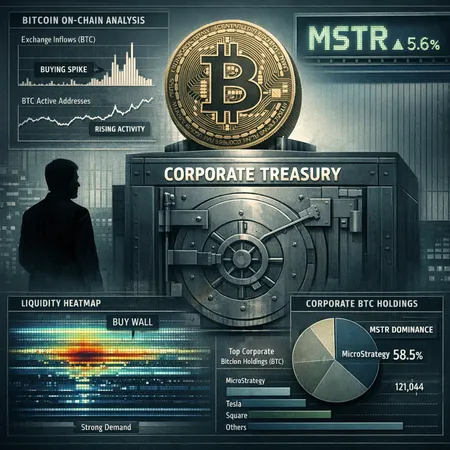
On‑chain supply signals: sovereign sales and miner economics
Sovereign sales: the Bhutan example
Q1 and early 2026 saw a material, illustrative case of sovereign selling. Bhutan reportedly netted about $120 million of BTC sales in 2026, a clear example of how state actors can become supply sources (source: Coinpedia). Sovereign sales differ from retail or miner sales in two ways: they often involve large, concentrated transfers and they may be motivated by fiscal needs rather than cyclical trading.
Implications:
- Large sovereign sell blocks can swamp short‑term demand, particularly during periods of ETF outflows or low general liquidity.
- Because sovereign sales are often premeditated and infrequent, they introduce one‑off supply shocks rather than a steady stream of coins.
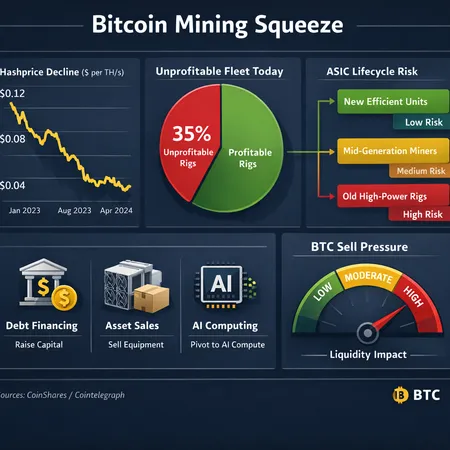
Miner economics and forced supply
Miners remain an underappreciated structural supply source. Recent analysis shows steep production economics where, in stressed conditions, miner breakevens and realized economics leave them selling into price to cover operating and capital costs (source: Blockonomi). Some miners have reportedly been producing at effective losses, reducing hodl‑incentives and increasing immediate sell pressure.
Two miner dynamics to watch:
- Inventory liquidation: Stressed miners sell miner reserves and newly mined coin to cover ASIC financing and energy bills. That supply enters spot markets directly or via OTC desks that feed ETFs and exchanges.
- Capex pivoting: Some miners are reallocating capital toward AI infrastructure or selling rigs to raise cash—actions that can permanently reduce future hash growth and thus future supply dynamics, but in the short run they increase selling.
The bottom line: sovereign sales and miner distress are real, measurable sources of supply that can counterbalance even materially higher ETF demand.
Macro overlay: rate expectations, real yields and BTC sensitivity
Bitcoin’s narrative has evolved from a pure digital‑gold story to a more nuanced instrument: it is partly driven by risk appetite, partly by liquidity, and partly by macro fundamentals such as real rates and inflation expectations. In Q1, shifting rate expectations—markets pricing changes to central bank policy—have meaningfully altered BTC’s opportunity cost.
- If real rates fall: The yield advantage of cash or bonds diminishes, making BTC relatively more attractive as an inflation or growth hedge. That scenario amplifies any positive ETF flow momentum.
- If rates stay higher for longer: The opportunity cost of holding non‑yielding BTC increases. This hurts adoption among yield‑sensitive institutions and can exacerbate miner selling (since financing and energy costs remain elevated).
Combined with the ETF and supply signals above, the macro picture suggests BTC’s short‑term moves will be highly sensitive to headline rate bets. For example, a surprise dovish pivot could quickly reverse outflow‑driven pressure, while hawkish surprises could amplify it.
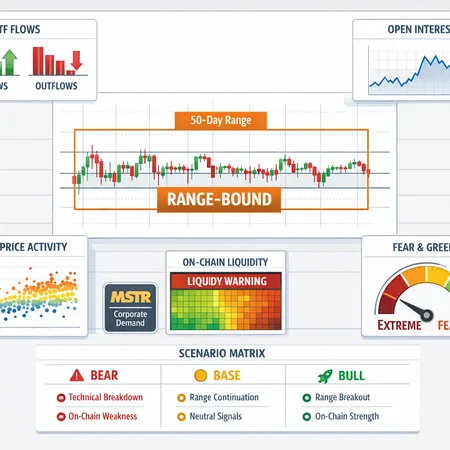
What this means for the short‑ and medium‑term BTC outlook
Short term (weeks to 3 months): expect pronounced volatility and range trading. ETF outflows of the scale observed in Q1 amplify downside risk when matched with concurrent sovereign or miner selling. Event risk—rate prints, large sovereign auctions, surprise miner auctions—can create sharp directional moves.
Medium term (3–12 months): fee compression and broader institutional adoption still matter. Cheaper ETFs such as Morgan Stanley’s 0.14% product can expand the investor base, but supply shocks from miners and occasional sovereign sales will continue to put a lid on a clean, sustained upward trend unless macro conditions shift favorably (lower real yields, improved liquidity). In other words, adoption is increasing the addressable demand pool, but structural supply sellers can neutralize parts of that demand.
Tactical checklist for institutional investors and advisors
- Monitor ETF flows daily. Flow reversals can be fast and should trigger balance‑sheet and liquidity checks.
- Watch miner reserve movements on‑chain and follow miner revenue and hashrate metrics to detect forced selling early.
- Track sovereign wallet activity and large OTC movements—these are one‑off but high‑impact events.
- Reassess model portfolios: use fee‑adjusted returns when choosing ETFs, but also include operational quality and liquidity in the decision process. A very low fee ETF is attractive, but not if spreads widen materially during stress.
- Maintain liquidity buffers and consider staged allocations (dollar‑cost averaging or tranche entry) rather than lump‑sum exposure for clients who may need liquidity.
- Stress test allocations across macro scenarios: dovish pivot, sticky inflation/higher rates, and large sovereign sales.
Platforms that facilitate fractional or installment exposure (for example, Bitlet.app) can be part of a diversification strategy, but they do not replace careful flow and liquidity management.
Final thoughts
Q1 2026 made one thing clear: ETFs are not an automatic one‑way bid. Spot‑ETF flows, lower fees and on‑chain supply moves are restructuring how BTC reacts to both micro and macro shocks. For advisors and institutional allocators, the era of complacent allocation assumptions is over. The smart play is to treat ETFs as powerful distribution engines that come with flow volatility, to respect the outsized influence of supply sellers (sovereigns and miners), and to build allocation frameworks that marry fee sensitivity with operational resilience.
Sources
- Cointelegraph — Bitcoin ETFs break 4‑week inflow streak, $296M weekly outflows: https://cointelegraph.com/news/bitcoin-etfs-break-4-week-inflow-streak-outflows-directional-risk?utm_source=rss_feed&utm_medium=rss&utm_campaign=rss_partner_inbound
- Blockonomi — Morgan Stanley’s proposed 0.14% Bitcoin ETF: https://blockonomi.com/morgan-stanley-ms-launches-ultra-low-0-14-bitcoin-etf-to-challenge-market-leaders/
- Coinpedia — Bhutan net sells $120M BTC in 2026: https://coinpedia.org/news/bhutan-sells-bitcoin-dumps-120m-worth-of-btc-in-2026/
- Blockonomi — Miner economics and production losses: https://blockonomi.com/bitcoin-btc-miners-bleed-19k-per-coin-pivot-hard-toward-ai-infrastructure/