Why Yields, Oil and Middle East Headlines Are Squeezing Bitcoin Now
Summary
Executive snapshot
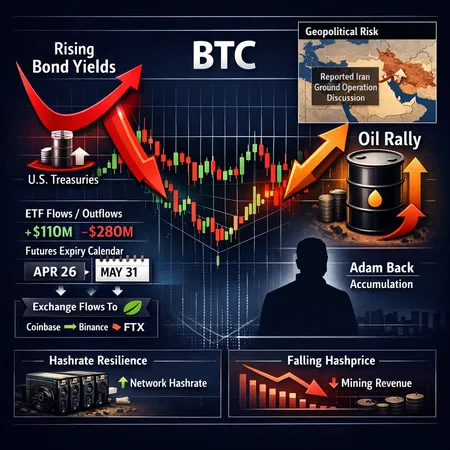
This week’s Bitcoin moves aren’t about any single headline. Instead, they’re the product of three macro threads tightening at once: rising U.S. bond yields, an oil price rally that feeds inflationary pressure, and a geopolitical risk spike around Iran. Layer on ETF and futures flow dynamics — plus unusual exchange accumulation flagged by large‑wallet activity — and you get a market that’s unusually sensitive to small catalysts.
For macro traders and portfolio managers this matters because BTC’s price compression today could either be a transient liquidity event or the start of a larger downshift if macro and on‑chain signals align. Below I unpack each channel, show what on‑chain confirmations to watch, and end with an actionable risk‑off checklist.
The macro backdrop: bond yields and oil are working together
Two forces are worth treating as a package: U.S. Treasury yields and oil prices. Rising yields raise the discount rate investors apply to risky assets; higher oil lifts inflation expectations and can force central banks to stay hawkish. When both move together, the macro case for risk assets becomes that much harder.
Analysts are already pointing to this combination as a headwind for BTC. A recent review connected rising Treasury yields and an oil rally to growing pressure on Bitcoin, arguing that the joint move can undercut the speculative premium that BTC relies on in the short term (Blockonomi). From a portfolio perspective, higher real and nominal yields both reduce the relative attractiveness of a non‑yielding asset like BTC and increase the likelihood of equity reallocation to cash or bond instruments.
Important nuance: BTC’s correlation to yields and equities is not fixed. In some episodes, geo‑political shocks have made BTC act like a store of value; in others it behaves like a risk asset. That means you need second‑order signals to tell which regime you’re in.
The immediate geopolitical trigger: Iran chatter raises near‑term volatility
News that the Pentagon has discussed the option of a ground operation in Iran has become a near‑term volatility trigger for BTC and broader markets (crypto.news). Geopolitical risk often cuts both ways for Bitcoin: it can push flows into perceived safe havens, but it can also spur USD strength and flight to cash if investors close risky positions.
Right now the market seems to be treating the Iran headlines as a reason to trim risk rather than buy BTC as a geopolitical hedge. That subtlety matters: when headlines cause funding pressures, liquidations cascade and technically amplify moves that started as macro squeezes.
ETF and futures dynamics: outflows, expiry and basis pressure
ETF flows and derivatives positioning are the plumbing that determines how macro moves translate into BTC spot action. Two dynamics are key:
Spot ETF flows: recent days have seen net outflows from some spot products, which removes a structural bid during thin sessions and increases sensitivity to negative headlines. Outflows can force short‑term sellers to come into a market that otherwise might have balanced on ETF demand.
Futures expiry and basis/funding: quarterly expiries and concentrated rolling can squeeze basis (the premium/discount between futures and spot). If open interest is high heading into an expiry, a shock — like a sudden yield move or a geopolitical spike — can force deleveraging, producing outsized spot moves as proxied risk hedgers rebalance.
Watch the futures basis, open interest, and funding rates for signs that derivatives desks are tightening up. A sustained move from positive to negative basis (futures trading below spot) can precede a larger dislocation in spot.
Exchange flows and unusual accumulation: the Bitfinex signal
On the exchange side, two contrasting signs have appeared: broad outflows from some ETF‑sensitive instruments, and unusually large accumulation on Bitfinex. The latter was highlighted by Adam Back as an unprecedented Bitfinex accumulation signal — roughly a 79,000 BTC cluster flagged as distinct wallet/exchange movement — which some interpret as major wallet accumulation that can support downside (U.Today).
What to make of this? Large exchange-level accumulation does not automatically mean immediate bullishness. It can represent a long‑term strategic buyer, a custodian shuffle, or even an overhang that will be sold into rallies. However, if exchange netflow turns negative (more BTC leaving exchanges) while these large wallets consolidate, that’s a stronger signal of supply drying up.
Key on‑chain metric: net exchange flow (inflow minus outflow). If inflows spike alongside price weakness, selling pressure is being supplied from exchanges. If inflows fall and large wallets continue accumulating, downside is more likely to be limited.
Mining and network backdrop: hashrate resilience vs hashprice pressure
The mining picture is a study in contrasts. Network hashrate has shown resilience — hashing power remains high — while hashprice (miner revenue per unit of hashpower) is under pressure when BTC price dips and fees are muted. Analysis suggests a structural shift: some smaller miners are capitulating while larger, vertically integrated miners remain steady, which limits immediate sell pressure but creates underlying stress (AMBCrypto).
Why this matters: miner selling can be a persistent source of supply if miners are forced to cover operational costs or service debt. If hashprice stays depressed and more miners capitulate, long‑term downward pressure could build even as reported hashrate looks stable.
Watchlist items: miner reserve levels, on‑chain miner outflows, and exchange deposits that trace back to known mining pools.
Signals that would confirm a real trend change (not just a squeeze)
A transient squeeze becomes a trend change when multiple independent channels align. Look for the following constellation:
Macro: a sustained move in U.S. 10‑year yields materially higher (e.g., a multi‑week stair of rising yields) combined with a persistent oil rally that keeps inflation expectations up. See the macro linkage discussed by Blockonomi.
Geopolitical: headlines that drive a durable USD rally and persistent risk‑off flows rather than a fleeting safe‑haven bid. The Iran reporting shows how a single narrative can spike volatility (crypto.news).
Market plumbing: sustained ETF outflows while futures basis turns persistently negative and open interest compresses as leveraged longs de‑risk.
On‑chain confirmations: rising exchange inflows, increasing short‑term holder realized losses, declining supply in profit (MVRV), and miner outflows hitting exchanges.
Large wallets: the Bitfinex accumulation either reverses into heavy sell pressure or is followed by continued accumulation with withdrawals to cold storage, which would be bullish (U.Today).
If most of these line up, treat the event as a regime shift rather than a liquidity squeeze.
Practical trade and portfolio checklist for risk‑off scenarios
Below are concrete, prioritized steps for macro traders and portfolio managers. Think of this as a triage flow: prepare, hedge, act.
- Prepare (short horizon, low friction)
- Reduce directional leverage on BTC positions first. Volatility squeezes hurt leveraged longs faster.
- Lower target position sizes for new entries; require clearer on‑chain confirmation before adding.
- Increase cash buffers to take advantage of potential dislocations.
- Hedge (medium horizon)
- Use short-dated options (protective puts) to cap downside while keeping upside exposure. If options skew is expensive, consider collars.
- Buy inverse futures or take short futures positions sized to a portion of the long exposure — avoid overhedging which can cascade on mean reversion.
- Act (triggered by confirmations)
- If exchange inflows spike and futures basis collapses, trim beta exposure further and shift to cash or stablecoins.
- If miner outflows accelerate to exchanges and MVRV enters sustained negative territory, consider tactical short bias or risk reduction across crypto allocations.
- If large‑wallet accumulation continues alongside decreasing exchange supply, rotate back into BTC gradually.
- Tactical execution rules
- Use staggered re‑entries rather than single large purchases. That reduces timing risk against expiry/flow events.
- Avoid carrying unhedged leveraged positions into major quarterly expiry windows.
- Monitor funding and basis intraday; a sudden funding squeeze is often the immediate precursor to big spot moves.
- Portfolio governance
- Re‑state maximum drawdown limits for crypto allocations and ensure compliance with those limits during volatile weeks.
- Communicate stop‑loss and hedging rules to stakeholders; don’t let discretionary impulses override pre‑agreed thresholds.
How to monitor this in real time
Focus on a short watchlist that blends macro and on‑chain indicators:
- U.S. 10‑year yield moves and term premium narratives
- Oil price and breakevens (inflation expectations)
- ETF net flows (daily) and major custodian activity
- Futures open interest, basis, and funding rates
- Net exchange flows and miner outflows
- Large wallet (exchange) accumulation signals
Tools: combine macro terminals for yields/oil, derivatives dashboards for basis/open interest, and on‑chain analytics for netflows and miner behavior. Bitlet.app users running portfolio stress tests can fold these signals into rebalancing rules without wholesale manual interference.
Final thoughts
This week’s squeeze is a reminder that Bitcoin no longer trades in a vacuum: macro yields, commodity prices and geopolitical narratives can compress liquidity quickly. Traders should resist the temptation to interpret a single on‑chain print as decisive. Instead, require alignment across macro channels (yields + oil), market plumbing (ETF/futures), and on‑chain confirmations (exchange flows, miner selling, large wallet behavior) before declaring a trend change.
If you systematically monitor those signals and apply the trade checklist above, you’ll be better positioned to avoid being whipsawed in a high‑noise, low‑liquidity environment.