Ethereum’s Price vs. Network: Why On‑Chain Growth Isn’t Moving ETH’s Price (Yet)
Summary
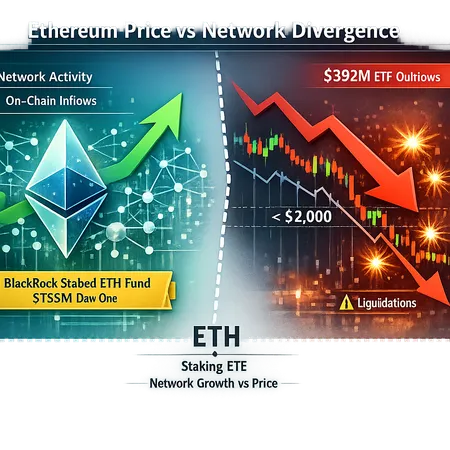
The divergence in one chart: network momentum vs. price pain
Ethereum’s on‑chain pulse has been beating faster: more active addresses, rising gas use in pockets, and renewed stablecoin movement into the chain. At the same time, ETH’s market price has looked fragile—recently breaking decisively below $2,000. That split is not just an academic curiosity for traders; it’s a live tension investors need to arbitrate between fundamental network strength and near‑term selling pressure.
Institutional staking flows are one tangible sign of long‑term conviction. BlackRock’s staked ETH vehicle pulled in roughly $155 million on day one, a meaningful validation of institutional demand for staking exposure and liquid staking products; that report was one of the clearest market signals that larger allocators are beginning to prefer on‑chain yield exposure over naked spot exposure (NewsBTC).
Why the BlackRock milestone matters
BlackRock’s raise is not merely headline fodder. It signals three structural shifts: institutional compliance and product wrappers are becoming mainstream; institutions may prefer staking yield (and custody solutions) to volatile spot exposure; and liquid staking inflows can compound staking supply dynamics over time. For portfolio managers, that matters because staking inflows can reduce a freely tradable supply pool, potentially supporting price over the medium term even if that effect takes months to play out.
Signs Ethereum fundamentals are returning
Several on‑chain indicators point to a healthier user and asset flow picture:
- Stablecoin flows into Ethereum: Stablecoins are the plumbing of DeFi and spot liquidity. Recent upticks suggest traders and projects are prefunding activity on Ethereum, a sign of demand for execution or investment on the chain.
- L1 activity recovery: Active addresses and certain usage metrics show pockets of returning activity—NFT launches, DeFi TVL rotation, and higher RPC calls in some segments.
- Smart money accumulation signals: Some analyses point to sizable smart money inflows and large‑holder accumulation that could presage a breakout if matched by macro tailwinds (Coinpedia).
These are important because network activity tends to drive longer‑term valuation narratives for Ethereum: more utility -> more demand for ETH as gas, collateral, or staking collateral. For context, many traders still view Bitcoin as a market bellwether, but Ethereum’s story increasingly runs on DeFi primitives and staking dynamics that differ from BTC’s store‑of‑value narrative.
What pushed price below $2,000 — ETF outflows and liquidations
Despite improving fundamentals, price weakness was acute: ETH plunged under $2,000 during a period when an estimated $392 million ETF exodus coincided with heavy derivatives liquidations and forced selling (Blockonomi). Technical analysis and market structure amplified the move: per post‑mortems, a cascade of stop losses and negative funding rates fed into each other, accelerating the downturn.
A contemporaneous analysis of the price event highlights mechanical triggers and broader vulnerability: market makers and ETF redemptions can create significant short‑term selling pressure, and when margin positions are extended, liquidations stack on top of that selling to magnify price moves (CryptoTicker). In other words: even if long‑term demand for staking or on‑chain activity is rising, liquidity provision and derivatives mechanics can cause sharp, temporary dislocations.
Liquidations, leverage, and the modern market’s fragility
The modern crypto market is leverage‑dependent. Futures open interest, concentrated OTC flows, and ETF constructions that must manage redemptions mean that large outflows can become self‑fulfilling short‑term price shocks. Liquidation cascades are not a sign that network fundamentals are broken — they’re a manifestation of market microstructure and sentiment.
Which on‑chain and macro indicators will decide the next move
For investors trying to reconcile the divergence, the checklist becomes tactical and directional. Below are the most actionable on‑chain and macro indicators to watch, and why they matter:
On‑chain indicators
- Exchange reserves: Net transfers of ETH to centralized exchanges tend to presage selling pressure; sustained declines in exchange balances are bullish. Watch daily net flows.
- Staking inflows and validator activation: Growing staking deposits, especially from institutional vehicles, reduce liquid supply and matter more over the medium term.
- Stablecoin-to-ETH flows: Net stablecoin inflows into Ethereum encourage buys for DeFi, AMMs, or leverage—an important short‑to‑medium‑term catalyst.
- Active addresses and gas fees: Rising active addresses and sustained fee demand reflect genuine utility. Temporary spikes are noise; a persistent uptick is signal.
- Concentration and whale behavior: Large‑holder accumulation versus distribution can presage a breakout or extended sell phase; smart‑money inflows flagged in research deserve attention (Coinpedia).
Derivatives and liquidity indicators
- Funding rates and basis: Negative perpetual funding and a steep negative basis indicate bearish leverage. A reversal to positive funding can reduce short‑term downside pressure.
- Open interest and liquidation clusters: Falling OI with price declines suggests deleveraging is underway; rising OI on weakness suggests further pain ahead.
- ETF flows and redemptions: Monitor the net flows of major staking or spot ETFs — redemptions can force mechanical selling, while consistent inflows would be supportive.
Macro liquidity and sentiment
- Risk‑on vs risk‑off environment: Equities, USD liquidity, and macro risk appetite still influence ETH’s beta. An easing cycle or dovish surprise could bridge the fundamental‑price gap.
- Interest rates and real yields: Lower real yields historically support risk assets; if rates compress, crypto can benefit.
Scenarios that reconcile network strength with price behavior
Map potential outcomes so you can size exposure and hedges.
Bullish baseline (months): Institutional staking continues, exchange reserves fall, smart money accumulates, stablecoin flows remain strong, and macro liquidity eases. Price gradually converges upward toward on‑chain strength. BlackRock’s demand is an early sign of this path.
Stalled convergence (weeks–months): Network metrics improve but are offset by intermittent ETF outflows, negative derivatives flows, and periodic liquidations. Price grinds sideways with sudden drawdowns; active risk management is essential.
Bearish spiral (short term): Large ETF redemptions or macro shocks trigger heavy selling; derivatives leverage compounds the move. Even with strong fundamental metrics, price can undershoot until leverage is cleaned up.
Practical takeaways for intermediate investors and portfolio managers
- Treat on‑chain fundamentals as a multi‑month signal, not a day‑trader’s confirmation. Institutional staking demand (e.g., BlackRock) is structurally bullish but not an antidote to mechanical liquidation risk.
- Use liquidity and derivatives metrics to manage timing: watch exchange flows, funding rates, and open interest before adding significant exposure.
- Consider staggered accumulation or dollar‑cost averaging if you believe in the long‑term narrative (staking ETF growth, DeFi rotation). Maintain hedges or position size limits to protect against sudden technical breakdowns.
- Keep an eye on stablecoin supply moves and active addresses; these give early evidence of on‑chain demand translating to flow.
- For portfolio managers requiring yield, liquid staking products can offer a compromise: capture staking exposure while maintaining tradability, but be aware of counterparty and protocol risks.
Final thought: fundamentals win, but timing is hard
Ethereum’s network dynamics—staging institutional staking inflows, returning L1 activity and renewed stablecoin movements—are meaningful. BlackRock’s early $155M haul is a clear institutional data point in favor of increasing staking demand. Yet markets do not move in a straight line. ETF outflows, negative funding, and liquidation cascades can and did drive ETH below $2,000 even while on‑chain indicators looked constructive (NewsBTC; Blockonomi; CryptoTicker).
If you manage capital, the right posture is pragmatic: respect the long‑term case but trade the near‑term structure. Watch exchange balances, stablecoin flows, staking trends, and derivatives signals. And remember: platforms like Bitlet.app are part of the evolving landscape that lets investors access staking and structured exposure—tools, not guarantees.
Sources
- https://www.newsbtc.com/altcoin/ethereum-sets-user-record-as-price-lags-far-behind-network-growth/
- https://cryptoticker.io/en/ethereum-price-crash-below-2000-analysis/
- https://blockonomi.com/ethereum-eth-plunges-under-2000-mark-amid-massive-392m-etf-exodus/
- https://coinpedia.org/price-analysis/ethereum-price-prediction-6-3b-smart-money-inflows-signal-major-eth-breakout-ahead/