Spotting and Surviving Bitcoin Liquidation Cascades: Leverage, Futures, ETFs, and a Tactical Checklist

Summary
Why liquidation cascades still matter in modern BTC markets
A liquidation cascade occurs when forced selling (margin calls, bankruptcies, exchange liquidations) triggers price moves that force more liquidations, producing a feedback loop of selling and volatility. These days the mechanics are more complex: on‑chain flows, concentrated leverage pockets and derivatives dislocations (funding, basis, options skew) interact with macro flows such as ETF subscriptions/redemptions and regional selling pressure to produce outsized moves.
Recent weeks offered a reminder: a large unexpected sell event — reported as 245k BTC liquidated or moved — rattled markets and exposed how quickly localized stress can ripple across venues and instruments (coverage summarized here). Traders and risk teams who ignore the layered signals risk being caught on the wrong side of a cascade.
How cascades form: leverage, market structure and feedback loops
At the core of a cascade is concentrated leverage. Perpetual futures and margin loans allow traders to amplify directional exposure; when price moves against them, forced deleveraging occurs. That forced deleveraging can be amplified by illiquidity — narrow orderbooks, concentrated bids, or off‑exchange transfers.
Technical on‑chain research shows leverage and other stress indicators often mark the build‑up well before the cascade becomes visible: rising exchange inflows, shrinking stablecoin buffers, and clustering of open interest across a few derivatives venues increase fragility. See a technical explanation of how on‑chain indicators and leverage typically show stress before liquidation cascades here: on‑chain signs of liquidation cascades.
The role of futures, open interest and basis shifts
Futures markets are the pressure valves — or pressure amplifiers. Three derivatives metrics matter most:
- Open interest (OI): rapid, concentrated increases in OI — especially on a few exchanges — mean more notional is at risk if price moves. Sudden drops in OI during a downturn often signal forced deleveraging.
- Funding and basis: extreme funding rates force counterparties to rebalance. A sharp move in perp basis (the premium/discount of perpetuals to spot) can precipitate mass liquidations when funding spikes and short squeezes collide.
- Option and term structure skew: steep option skew signals asymmetric tail risk; dealers hedge with futures and options, shifting liquidity across tenors and potentially worsening short‑term orderbook depth.
Derivatives experts caution that apparent cooling in spot prices doesn’t always equal true capitulation in derivatives markets; open interest and basis can mask persistent stress. One derivatives expert recently said they were not confident we had seen a true capitulation in Bitcoin derivatives — a useful reminder that futures markets can lag or amplify the next leg of a cascade (CoinDesk analysis).
Why U.S. selling pressure and spot ETFs amplify volatility
Spot ETF flows and the regional concentration of custodial sales matter. When spot ETFs experience outflows — especially in the U.S., where flows can trigger fast redemptions and exchange sales — the mechanical selling hits the spot market and creates basis pressure. Recent reporting flagged ETF outflows and U.S. selling pressure as dominant forces weighing on Bitcoin prices during a sell episode (reporting on ETF outflows and U.S. selling pressure).
When ETF redemptions coincide with concentrated futures long positions, the same price move that forces ETF custodial selling also forces liquidations on leveraged longs — a classic two‑sided squeeze. This is why ETF flows must be monitored alongside derivatives metrics: they are not independent risk factors but interacting drivers.
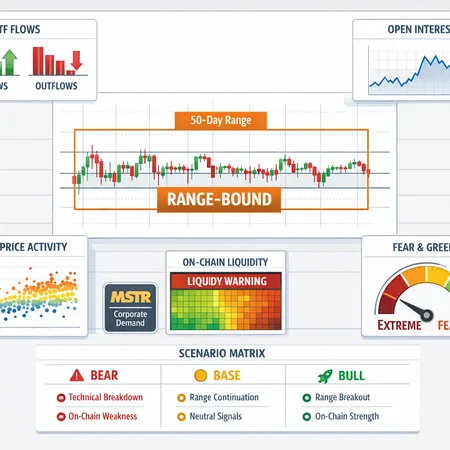
On‑chain signals that tend to foreshadow cascades
Below are high‑signal on‑chain and exchange metrics that often flash before a cascade. None are perfect individually; the value comes from their co‑movement.
- Exchange inflows spike: rapid transfer of BTC to centralized exchanges often precedes large sell events. Watch percentiles rather than absolute volume.
- Exchange reserves fall: shrinking exchange BTC balances suggest sell pressure; if reserves fall while inflows spike, liquidity is being consumed.
- Liquidation heatmaps: aggregated open interest by price levels shows where clusters of stop orders and liquidation triggers sit — these are the price 'tripwires'. Tools and on‑chain dashboards that render liquidation heatmaps can make that risk visible.
- Concentrated OI: >50% of open interest concentrated on two or three venues increases systemic risk. Rapid OI growth in a tight window is more dangerous than steady accumulation.
- Perp basis spikes / abnormal funding: sustained high funding rates (positive or negative) indicate leverage imbalance. Sudden weekend funding spikes or basis inversion can presage squeezes.
- Stablecoin and USDC/USDT flows: sudden inflows to exchanges of stablecoins can indicate ready buying power, but sudden outflows often accompany massive redemptions.
For a technical walk‑through of how some on‑chain indicators and leverage show stress before liquidation cascades, read this analysis: on‑chain technical piece.
Practical checklist: spot mounting cascade risk and protect positions
This checklist is designed for active traders and risk managers. Use it as an operational playbook during build‑up phases and live selloffs.
Pre‑trade and position sizing
- Watch OI growth rates: if BTC open interest rises faster than spot liquidity (orderbook depth), cap leverage at conservative levels. A practical threshold to flag: >15% OI growth in 7 days while orderbook depth (top 1% slippage) declines.
- Map liquidation heatmaps: identify clustered stop/liq levels near your entries. If >5% of circulating OI is within 3% of current price, treat the trade as high cascade‑risk.
- Cross‑exchange concentration: if more than two venues hold >60% of market OI, reduce size or diversify margin across venues.
Live monitoring (when price moves)
- Funding / basis watch: flag when 12‑hr funding >50 bps or perp basis deviates by >3% vs. spot on high OI. These are red flags for forced deleveraging.
- Exchange inflow/outflow divergence: large inflows with falling reserves + ETF redemption announcements = high liquidation risk.
- Option skew and put/call ratios: rapid skew steepening indicates demand for downside protection and potential for one‑sided deleveraging.
Risk mitigations and execution tactics
- De‑risk with hedges: use short futures or options to hedge directional exposure rather than relying only on stop‑loss orders; hedges can be cheaper during funding dislocations.
- Layered exits: stagger sell orders across price points and venues to avoid crossing thin books during a move.
- Use cross‑venue liquidity: splitting execution across venues and using OTC desks reduces slippage and the chance of single‑venue liquidation cascades.
- Add liquidity protection: when possible, post limit orders at strategic depth levels instead of market orders; during cascades you may prefer a smaller guaranteed fill to avoid slippage.
Operational thresholds (examples — customize for your desk)
- Flag condition: 7‑day OI growth >15% + 24hr exchange inflows in 95th percentile = increase margin requirements / reduce position size by 30%.
- Flag condition: perp basis >3% premium coupled with funding >20 bps for 24+ hours = hedge 50% of directional exposure.
- Emergency trigger: >5% realized spot drop plus >10% OI reduction in 6hrs = pause new entries, run liquidity sweep, contact clearing counterparties.
Case study: the 245k BTC move — anatomy and lessons
The large sell event covered by market outlets (245k BTC) contains instructive elements. Reported coverage suggested a concentrated, unexpected liquidation/sale that propagated through spot venues and derivatives desks (coverage here). Around the same window, ETF outflows and U.S. selling pressure were flagged as weighty contributors to the price move (ETF outflow reporting).
Put together with derivatives commentary that cautioned against assuming capitulation had occurred (CoinDesk expert view), we can infer a multi‑front stress event: custodial/ETF selling met concentrated leveraged longs and thin liquidity pockets, producing a cascade. On‑chain signs — exchange inflows, tightening reserves and clustered OI — would likely have given early warning if monitored in combination, consistent with on‑chain technical analysis of leverage buildups (beincrypto piece).
Lessons
- No single metric predicts a cascade; the predictive power rises when on‑chain, derivatives and flow data converge.
- ETF flows are a multiplier: they can turn a derivatives squeeze into large spot selling.
- Market commentary that claims "capitulation" should be taken cautiously; derivatives positioning can sustain latent stress.
Survival playbook: pre‑mortem and live execution steps
Pre‑mortem (daily checklist when markets are volatile)
- Scan liquidation heatmaps for clustered liq levels within ±5%.
- Check OI concentration and 7‑day growth percentiles across top venues.
- Monitor perp basis and 24‑hr funding — annotate any divergence >2–3%.
- Watch ETF flow dashboards and regional exchange flows (U.S. custody activity is particularly relevant).
- Update position sizing rules and communicate limits to traders/PMs.
Live execution (during a suspected cascade)
- Halt new directional entries and reduce existing exposure incrementally.
- Deploy hedges (short futures or bought puts) sized to the portion of exposure you can’t quickly close.
- Execute staggered liquidity sweeps across venues; use OTC for large blocks.
- Monitor liquidation heatmaps in real time and adjust hedges as stops are cleared.
- Post‑mortem trade: after volatility subsides, analyze what signals failed or succeeded and update thresholds.
Final thoughts
Liquidation cascades are complex but not inscrutable. The best defense is a layered approach: combine on‑chain monitoring (exchange flows, reserves, liquidation heatmaps) with derivatives metrics (open interest, funding, basis) and macro/flow context (ETF redemptions, regional selling). When those data streams align, act decisively: reduce leverage, hedge intelligently and spread execution.
For desks building tooling or automated monitors, integrate percentiles and co‑movement rules rather than absolute thresholds — cascades are about imbalance and concentration more than raw volume. Platforms and dashboards (and even services like Bitlet.app for flexible execution) can be part of the toolkit, but human judgement remains essential when markets cross the tipping points.
Sources
- https://beincrypto.com/liquidation-cascade-onchain-technical-analysis/
- https://coincu.com/news/bitcoin-steadies-as-etf-outflows-flag-u-s-selling-pressure/?utm_source=snapi
- https://www.coindesk.com/markets/2026/02/10/i-m-not-confident-we-hit-a-true-capitulation-in-bitcoin-derivatives-expert-says
- https://www.cointribune.com/en/245k-btc-liquidated-whats-happening-in-crypto/?utm_source=snapi
For many traders, Bitcoin remains the primary bellwether; treating liquidation cascades as multi‑instrument events — not just price moves — will improve survival odds. If you run risk systems, build dashboards that flag co‑movement (OI + inflows + basis) and test your emergency triggers under simulated cascades.