XRP Sell‑Off: $72M Liquidations, a $34.5M Near‑Miss Whale, and Where Support Holds
Summary
Quick recap: the dump and the headline numbers
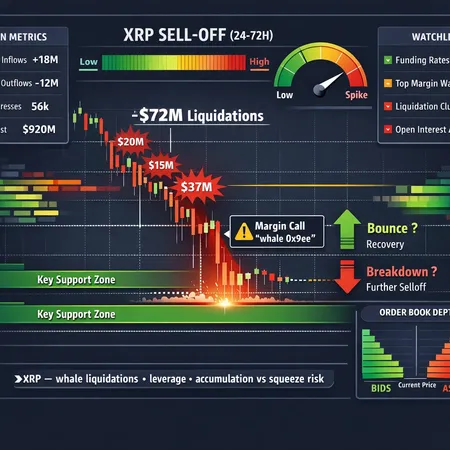
XRP suffered a sharp, leverage‑driven decline that liquidated a meaningful chunk of derivatives longs. Crypto outlets tracking the event put the total liquidations at roughly $72 million across exchanges, a figure corroborated in both the Coinpedia price analysis and its news report (Coinpedia analysis and Coinpedia news). Other coverage noted XRP dropped to a 3.5‑month low during the move, underscoring the technical damage to near‑term structure (CryptoPotato).
For many traders, XRP still acts like a midcap risk asset where leverage and whale flows can materially swing price in short windows.
Liquidations: how the $72M number breaks down and what it implies
Liquidations are the forced closure of leveraged positions by exchanges when margin thresholds are breached. The reported ~$72M figure primarily reflects long liquidations — longs cascaded as price moved lower and stop infrastructure clustered under thin liquidity.
Why size matters: in markets where derivatives open interest is concentrated, a $10–50M move can cascade through multiple exchanges' auto‑liquidation engines. That $72M is not just a headline; it represents real, executed selling that drained bids and widened spreads, meaning subsequent “buys” from opportunistic traders or whales had to clear through a now‑thinner order book.
The concentrated risk: whale wallet '0x9ee'
One concrete example of concentration was the near‑liquidation of whale wallet 0x9ee, which reportedly nearly hit a $34.5M liquidation threshold before being preserved by price action or on‑chain transfers (u.Today). That single near‑miss underscores two points:
- A handful of large positions can represent a material share of open interest and therefore magnify volatility.
- Whales often manage risk with off‑exchange liquidity or OTO (on‑the‑orderbook) hedges; near‑liquidations are informative but not definitive proof of intent.
Mechanics: leverage, funding, and order‑book thinness
Leverage amplifies directional moves. Two mechanics are most relevant:
- Funding rate pressure: Prolonged positive funding pushes long holders to pay shorts; if longs stay overly long while funding is high, a drop can trigger liquidations. Watch funding rate spikes as early warning signals.
- Order‑book depth and imbalanced liquidity: When the order book shows thin bids, even modest sell volume can sweep multiple price levels. Liquidations add sell pressure that further empties the bids — a feedback loop.
That feedback loop is what converted a normal pullback into the cascade that produced the $72M of liquidations. In such environments, even whales that buy into the weakness can unintentionally worsen slippage if they execute large taker buys against residual offers.
Support zones: mapping where price is likely to find buyers
Rather than guess exact prices (which can change by the minute), frame support in tiers that traders and on‑chain analysts can monitor:
Tier 1 — Immediate liquidity cushion (intraday): These are the visible bid clusters on exchange order books and liquidity on CEX orderbooks. If large resting bids exist, they can slow a slide. Watch for concentrated limit orders and delta between best bid/ask.
Tier 2 — Recent local demand zone (days–weeks): This is the area around the recent consolidation and the 3.5‑month low noted in market coverage. Historically, these zones attract short‑term buyers and stop‑hunters. If price stabilises here, look for volume spikes on on‑chain transfers and exchange outflows.
Tier 3 — Multi‑month accumulation band (structural): Longer‑term holders and accumulation addresses tend to cluster purchases across a band rather than a single price. On‑chain indicators (balance cohorts, realized price bands) reveal where long‑term investors added size — those bands often provide stronger support.
How to turn those tiers into trackable levels: use combined signals — order‑book heatmaps, exchange bid blocks, realized price concentration heatmaps, and on‑chain balance changes — rather than a single indicator.
Are whales buying an accumulation opportunity or creating squeeze risk?
Short answer: it can be both. The nuance matters.
Signs of genuine accumulation: steady, staggered buys into thinner moments; accumulation via transfers to cold wallets or long‑term addresses; buys that do not aggressively sweep the order book (limit buys placed under the market). If whale flows show increasing cold‑wallet balances and declining exchange balances, that's accumulation.
Signs of squeeze/short‑term buybacks: aggressive taker buys that lift the market and tighten stops, sudden increases in open interest after the buy, or buys that coincide with increased borrowing to re‑establish leveraged exposures. If whale buys correlate with rising funding rates and increased short covering, the action may be exacerbating short‑term volatility rather than signaling durable accumulation.
The reported activity around this dump included observable whale buying even as liquidations occurred (Coinpedia). That pattern can be opportunistic accumulation — but with concentrated positions like 0x9ee, it also carries systemic risk: if that whale is leveraged elsewhere or funds trades with borrowed capital, their subsequent deleveraging could create fresh waves.
Practical watchlist for traders and on‑chain analysts
Use this checklist to separate genuine accumulation from squeeze mechanics:
On‑chain metrics
- Exchange inflows/outflows: a steady net outflow to cold wallets suggests accumulation; inflows suggest selling pressure. Monitor changes in the short term.
- Large (>= $1M) whale transfers and the destination type (CEX vs. cold wallet). A transfer to a known OTC address or custodial wallet deserves closer scrutiny.
- Balance cohorts / realized price bands: where did current holders buy? Concentration near current prices implies less downside for long holders.
Derivatives and funding
- Funding rates across major derivatives venues: sudden spikes warn of crowded longs/shorts. A flip from negative to positive funding can presage a squeeze.
- Open interest vs. spot volumes: a falling open interest while price falls suggests deleveraging; rising OI amid a drop signals fresh leverage being added.
Exchange order books and liquidity
- Depth at key price levels: check aggregate CEX bids and cluster sizes. Thin bids mean higher slippage on aggressive orders.
- Hidden liquidity / iceberg orders: these can absorb some selling, but discovery is hard — use book-depth heatmaps.
Event and on‑chain alerts
- Watch for large limit orders placed right below major support (potential liquidity traps) and large rapid transfers between exchanges.
- Track specific whale addresses (e.g., 0x9ee) and set alerts for their on‑chain activity.
Market microstructure
- Time & sales skew (taker buy vs taker sell imbalance). If most executed trades are taker buys after a dump, the market is being bought through — could be accumulation or forced buybacks.
Bitlet.app users routinely combine exchange data with on‑chain signals to get a fuller picture; using both sources reduces false signals.
Trade planning and risk management
If you trade or size positions in this environment:
- Keep position sizes small relative to total capital; leverage compresses margin of error.
- Avoid adding to a position solely because a whale is buying — ask whether that whale reduced exchange balances (good) or left funds on exchange (less convincing).
- Use layered entries and defined stop zones tied to your support‑tier mapping; prefer limit orders within identified liquidity bands to avoid sweeping slippage.
- Monitor funding rates and open interest — a sudden OI rebuild can mean the market is primed for a new leveraged move.
Final read: balancing evidence
The recent XRP event shows how concentrated leverage and large wallets amplify moves: roughly $72M in liquidations created a thinner market where a near‑miss of $34.5M on wallet 0x9ee became a meaningful story. Whales buying into the weakness can legitimately be accumulating, but the same flows can exacerbate squeezes if they interact with a fragile order book or if their positions are themselves leveraged.
For traders and on‑chain analysts, the path forward is empirical: marry order‑book heatmaps, funding/open interest dynamics, and direct on‑chain transfer behaviour to distinguish durable accumulation from a short‑term liquidity play.