Bitcoin's Fragile Position: Cost-Basis Concentration, Liquidity Risk and the Levels That Matter
Summary
Quick take
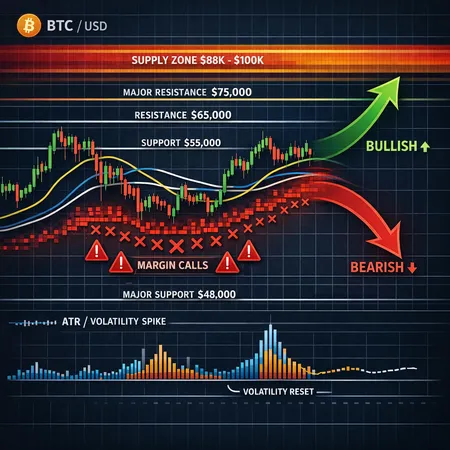
Bitcoin's recent price action looks fragile, not because the macro narrative is broken — far from it — but because the market's internal structure is concentrated and levered. On-chain analysis shows more than half of invested supply sits with a cost basis above about $88,000, a setup that creates asymmetric selling pressure if prices slip below clustered entry points. At the same time, short-term holders are already running losses and leveraged positions sit ready to unwind. For active traders and risk managers this combination raises the odds of sharp drawdowns and a volatility spike before a durable trend resumes.
Why invested-supply concentration matters
When a large portion of the invested supply is clustered well above the current market price, the distribution of unrealized gains/losses becomes lopsided. The CoinDesk analysis finds that more than half of invested BTC has a cost basis above ~$88,000 (CoinDesk analysis). That concentration matters for three reasons:
- Selling velocity: holders who are underwater or near break-even are more likely to sell into weakness, especially if sentiment or margin pressure worsens.
- Margin cascades: clustered cost bases attract short covering and long liquidations in the same price bands, amplifying moves.
- Support illusion: put another way, what looks like support on a simple chart can become a magnet for stop orders and liquidation triggers when many participants share similar P&L thresholds.
This isn't just theoretical. Markets with concentrated cost-basis clusters have historically seen outsized volatility when liquidations cascade — a fragile structure that can turn small catalysts into large moves.
Short-term holders and the liquidity reset problem
Glassnode-derived notes show a meaningful share of BTC supply held by short-term participants is already sitting in loss. Crypto.News summarizes that roughly 22% of supply associated with short-term holders is underwater and needs a liquidity reset to clear the deck (crypto.news on short-term holders). A liquidity reset here means selling pressure that forces prices lower until those coins change hands at new, lower cost bases — effectively resetting realized distribution and reducing fragility.
Practical implications:
- If price chops lower 8–15% from here, expect short-term holder capitulation and increased on-chain transfers to exchanges.
- That selling occurs into an already concentrated invested base — increasing the chance of buying liquidity drying up quickly and triggering larger follow-through moves.
Leverage unwind and funding plumbing
Leverage is the plumbing that turns price moves into cascades. When funding rates are elevated and perpetual swaps are crowded, small directional moves can trigger large forced liquidations. Technical research and market commentary point to this dynamic in the current market: technical trend support has been tested and funding-related selling pressure is materially more dangerous than in a de-levered environment (Crypto.News on dynamic MA and leverage reset).
Two operational mechanics to watch:
- Funding and open interest: a spike in open interest concurrent with a breach of a trend support often precedes violent unwind events as exchanges forcibly deleverage positions.
- Order-book depth: clustered stop-loss orders under popular support zones create predictable liquidation bands.
A leverage unwind is rarely a single clean drop. Instead it tends to be a cascading series of delta hits and stop runs that accelerate once key areas fail.
What the volatility indicators are saying
Market coverage has noted a renewed volatility spike as traders reassess risk and test the new trading range (CryptoPotato coverage). From a signal perspective:
- Realized volatility rising while implied volatility lags is typical ahead of squeeze events — options traders often underprice the next leg of movement.
- Dynamic moving averages (shorter-term MAs versus longer-term trend MAs) are useful to detect a rotation from trend-following to range-trading. A close below a multi-month dynamic trend (for example the confluence of 50-day/100-day moving-average support) would suggest the market has moved from consolidation into a deeper corrective regime.
Technically, these signals indicate elevated asymmetric risk: the market can chop inside a range for weeks and then overturn into a fast downward move once leverage and concentrated cost-basis pressures align.
Key support and resistance framing (how to think in levels)
Rather than offering single static prices (which lose relevance quickly), traders and risk managers should think in terms of bands and percent moves tied to structural consequences:
- Soft support band (initial): a shallow pullback of ~5–10% typically tests liquidity-providing buyers and could flush weak hands without forcing systemic deleveraging.
- Critical support band (stress test): a 10–20% drop is often sufficient to push many short-term holders into realized losses and to trigger a meaningful leverage unwind, especially given the invested-supply concentration noted above.
- Breakdown/wider sell-off (capitulation): moves beyond ~20% increase the likelihood of larger liquidation cascades and a full liquidity reset across multiple participant cohorts.
Resistance should be seen similarly: an intra-range rally that fails to flip trend MAs back to support is vulnerable to reversion. Use moving-average confluence, volume profile, and on-chain equilibrium price clusters to mark the most relevant bands.
Scenario playbook: three near-term cases and tactics
Scenario A — Controlled pullback (5–10%)
Expectation: Volatility tick up briefly, selling is absorbed by longer-term participants; short-term holders trim but no major leverage cascade.
Trader actions:
- Short-duration strategies: look for intraday mean reversion entries; tighten stops near local lows.
- Use options to collect premium (sell covered calls or cash-secured puts) with tight risk controls.
- Monitor funding rates; if they flip negative and funding widens, favor short-gamma strategies.
Allocator actions:
- Opportunistic DCA additions: increase allocations incrementally rather than lump-sum; maintain pre-set rebalancing bands.
- Avoid adding leverage; prioritize custody and counterparty risk checks (e.g., custody at regulated providers).
Scenario B — Leverage unwind / liquidity reset (10–20%)
Expectation: Short-term holders capitulate, open interest collapses, realized volatility spikes and realized losses climb as invested supply clusters get re-priced.
Trader actions:
- Reduce directional exposure and avoid one-sided funding bets. Consider hedged positions (long spot + short futures) to neutralize funding volatility.
- If nimble, look for mean-reversion scalps after the rapid leg finishes; higher time-frame confirmations are crucial.
- Keep stop placement wide enough to avoid noise but size positions conservatively (smaller position sizes to account for gap risk).
Allocator actions:
- Consider staged accumulation only after visible on-chain transfer of coins from exchanges to long-term custody (sign of capitulation absorption).
- Rebalance long-term portfolios to target allocation bands; treat part of the decline as opportunity but avoid emotional averaging.
Scenario C — Breakdown and broader capitulation (>20%)
Expectation: Deep reset in realized distribution, elevated volatility persists, and a larger macro- or liquidity-driven catalyst may follow.
Trader actions:
- Preserve capital: focus on risk-managed short-term trades, volatility selling only if you can manage assignment risk.
- Options protective collars can limit downside while allowing participation in rebounds.
Allocator actions:
- Large lump-sum buyers should prepare to scale in across multiple tranches and maintain dry powder — but not at the expense of risk limits or liquidity needs.
- This environment favors long-term holders with high conviction and the ability to ride large drawdowns; otherwise, rebalance to risk tolerance thresholds.
Practical monitoring checklist (what to watch in real time)
- On-chain: net flows to exchanges, realized-cost distribution shifts, and active supply changing hands.
- Derivatives: funding rates, open interest, and liquidations data.
- Technical: closes relative to dynamic MAs (50/100/200-day equivalents), and key volume-profile nodes.
- Sentiment: concentration of social attention and fear/greed measures that historically lead or lag price.
Also keep an eye on cluster-focused metrics such as the concentration of invested supply above particular price points — these are early warning lamps for asymmetric downside.
Final thoughts for practitioners
Bitcoin's current fragility is a structural story as much as a price story. The combination of a concentrated invested supply above ~$88k, short-term holders sitting in loss and needing a liquidity reset, and a technical picture that has flirted with key moving-average support creates an environment where volatility spikes and leverage unwinds are more likely than in a low-leverage, broadly distributed market. Traders should favor clear risk-sizing, hedges, and disciplined stop planning; allocators should trade conviction for process: staged accumulation, rebalancing, and operational readiness (custody, fees, execution).
For those looking to execute or manage exposure, platforms that offer flexible tools for installment purchases, earning strategies, or P2P can help implement staged accumulation or hedged exposures — Bitlet.app is one such example that combines features catering to different time horizons.
Sources
- CoinDesk — More than half of Bitcoin's invested supply has a cost basis above $88,000
- Crypto.News — Short-term holders need liquidity reset as 22% of BTC supply sits in loss
- CryptoPotato — Bitcoin volatility spikes as investors reassess risk
- Crypto.News — Bitcoin dynamic MA support and leverage reset analysis
For deeper reading on persistent market structures, see on-chain and macro commentaries and keep tabs on order-book liquidity and funding across venues. For market context, remember that cross-market flows (spot, futures, options) and on-chain transfers often tell the story before price fully discounts it. And for tactical trade ideas, combine on-chain triggers with clear technical confirmations before committing size.
For readers tracking related themes, note how narratives such as institutional adoption or DeFi activity can overlay these technical risks; for example, developments in Bitcoin or adjacent DeFi narratives can materially change liquidity dynamics over weeks.


