Bitcoin Consolidation in 2026: Liquidity, Institutional Treasuries, Miner Sales and Volatility Risks
Summary
Executive overview
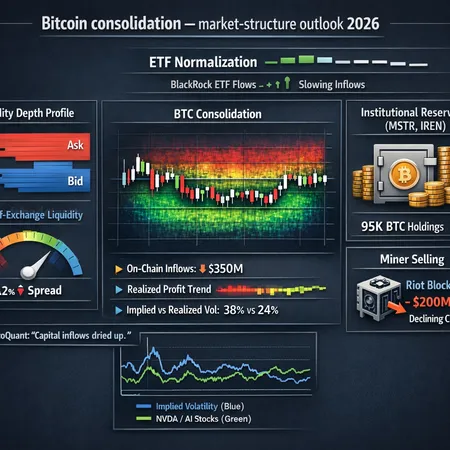
Bitcoin's current consolidation is a structural episode, not just a pause. Price action in 2026 reflects ETF normalization after a concentrated buying window, growing friction from miner sales, and institutional behavior that is simultaneously supportive (treasury accumulation) and fragile (equity-correlation risk). On-chain indicators—exchange balances, realized profit trends and miner flows—show liquidity is tighter than headline volatility implies. This piece synthesizes public reporting and on-chain signals to offer scenario probabilities, expected volatility regimes, and practical portfolio rules for HODLers and active traders.
What happened: concentrated ETF buys, then a cooldown
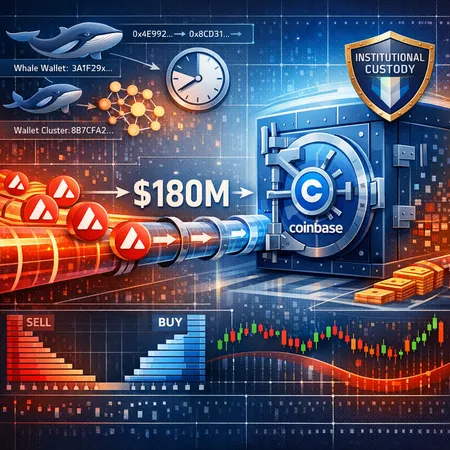
The sequence that set the tone for consolidation was visible and highly concentrated. Several reports traced a multi-day accumulation of BTC and ETH by major asset managers that temporarily lifted prices and reduced available exchange liquidity. Coverage of BlackRock’s concentrated buying shows how a short burst of creation activity can spark a rally and then a cooldown once flows slow: this pattern fits the market's recent snap higher and subsequent sideways action (BlackRock buying spree coverage).
That concentrated appetite is not the same as sustained retail or institutional adoption. When ETF flows become lumpy—big concentrated purchases followed by pauses—price can consolidate in a tight range while on-chain liquidity rebuilds. For many traders, Bitcoin now behaves like an asset with deep structural demand but limited short-term liquidity.
Institutional treasuries: a dual-edged support
Institutional treasury holders such as MicroStrategy (MSTR) and certain tokenized exposure vehicles (e.g., IREN) continue to act as marginal demand anchors. Large corporate treasuries change the supply/demand calculus: they reduce circulating float and increase the stickiness of long-term supply. However, institutional treasuries can also be sources of rebalancing risk—companies mark-to-market their holdings and may sell into strength or rebalance during corporate liquidity events.
The practical implication: treasury accumulation tends to lower realized volatility over medium horizons because it removes supply, but it also raises sensitivity to institutional balance-sheet stress and equity-market correlations (discussed below). Portfolio managers should account for both effects when sizing allocations to BTC or to equities-heavy firms like MSTR.
Miner selling and exchange supply: Riot’s $200M sale as an inflection signal
Miner selling remains one of the clearest on-chain supply shocks. The recent report that Riot sold roughly $200 million in Bitcoin is a reminder that miner liquidity can flood markets abruptly when operational needs or hedging/licensing actions occur (Riot sale coverage). Miner outflows to exchanges and OTC desks directly raise the available sell-side depth.
Key metric to watch: miner-to-exchange flows (net miner sell volume) combined with total exchange balances. A sustained uptick in miner sales while exchange balances rise signals genuine liquidity pressure; a momentary miner dump with stagnant exchange balances is more likely an idiosyncratic event that the market will absorb.
Capital inflows: are they gone? CryptoQuant’s warning
On-chain analytics firms are flagging an important trend: capital inflows into Bitcoin spot channels appear to have ebbed. The CryptoQuant CEO recently warned that inflows have dried up, meaning the marginal buyer—especially the ETF buyer—may not be as persistent as during prior rallies (CryptoQuant CEO view).
When inflows slow, the market becomes more sensitive to sellers. Narrow bid depth and thin liquidity can keep realized volatility elevated even if price ranges look tame. For traders this means smaller orders can move price more, and institutional allocators must be cautious about how quickly they scale in or out of positions.
Macro tail risk: Nvidia/AI equity linkage and potential institutional deleveraging
A less-discussed but meaningful linkage is that some institutional BTC exposure sits within firms or funds that are also heavily invested in AI equities—Nvidia being the poster child. Analysis suggests Bitcoin has become indirectly exposed to Nvidia-driven flows: a sudden equity reallocation from AI winners could trigger cross-asset selling in BTC, especially from multi-asset institutional desks (Bitcoin–Nvidia linkage analysis).
This creates a tail-risk channel: an equity shock that forces margin calls, liquidity repairs, or portfolio reweights could cascade into BTC via programmatic selling or stop-outs. Scenario planning should therefore include a correlated equity sell-off as a non-negligible source of BTC downside.
Liquidity metrics and realized profit trends to watch
Focus on the following on-chain and market indicators—these are the most actionable for sizing risk:
- Exchange BTC balances: rising balances = more available sell-side liquidity. A key short-term leading indicator.
- Miner-to-exchange flows: sustained positive net miner flows pressure price; paired with rising exchange balances it indicates a supply wave.
- ETF creations/redemptions and blocky buy windows: concentrated creation days followed by flat issuance usually precede consolidation. See the BlackRock episode above.
- Realized profit distribution: measure of how much supply would be in profit if spent. A large cohort in profit increases the number of potential sellers on strength.
- On-chain realized cap and realized volatility: as realized cap grows faster than market cap (large realized profits), downside tail risks rise because more holders can monetize gains.
- Derivative metrics: funding rates, OI in perpetuals and options skew—tight funding and flat skew often presage lower implied vol, but spikes in skew can indicate risk of directional moves.
Together, these metrics give a composite liquidity-risk score. When exchange balances are low, miner selling is muted, and realized profit cohorts are small, the market can absorb larger buys without sharp volatility. The reverse combination is a setup for violent range expansion.
Volatility regimes and scenario probabilities for 2026
We can roughly map three regimes for the year ahead:
Low-volatility consolidation (base case, ~50% probability): ETF flows remain moderate, miners keep routine hedging, and institutional treasuries stay put. Realized volatility compresses to the lower end of recent ranges while occasional intraday spikes occur on flow days.
Episodic spikes (tail-but-plausible, ~35% probability): Miner dump(s) or a concentrated ETF redemption/stop out triggers short-term sharp moves—price gaps and VIX-like jumps in BTC volatility. This is the regime implied by concentrated buys followed by sudden miner sales.
Correlated institutional sell-off (tail risk, ~15% probability): A shock to AI/tech equities forces rebalancing and margin relief across multi-asset desks, causing programmatic BTC selling and a larger drawdown. This is the scenario described by analyses linking BTC exposure to Nvidia-driven positioning (Nvidia exposure risk analysis).
Expected realized-volatility ranges: if the market sits in regime 1, realized 30-day vol may compress toward ~40–60% annualized (still high vs traditional assets). In regime 2, expect intraday realized vol to spike above 100% annualized temporarily. Regime 3 could see multi-week realized vol north of 120% with large drawdowns.
Practical rules for portfolio managers and experienced traders
Below are pragmatic, actionable rules—calibrated for 2026’s consolidation environment.
For HODLers (multi-year allocation):
- Keep strategic allocation sizing diversified: treat BTC like a volatile, return-seeking allocation rather than cash. A 3–10% portfolio allocation is a sensible starting range for many institutions.
- Use DCA or tranche buys to avoid one-way liquidity risk during concentrated buy windows; avoid scaling large positions into blocky ETF-driven rallies.
- Monitor exchange balances and miner flows as stop-gap signals: if exchange balances spike and miners are net sellers, pause accumulation until liquidity normalizes.
- Periodic rebalancing: rebalance on calendar or when BTC allocation drifts beyond ±25% of target rather than trying to time short-term consolidations.
For active traders and portfolio managers trading volatility:
- Size positions to live through 2–3x realized-vol shocks: given the regime uncertainty, anticipate brief periods of >100% annualized vol.
- Use realized profit cohorts as a guide for liquidity: avoid aggressive long legging when >60% of supply is in realized profit.
- Prefer options structures for express risk control: use put spreads or collars rather than short naked positions. Selling premium is tempting in low-vol regimes but can be ruinous on tail events.
- Keep directional exposure adaptive: reduce levered directional exposure when ETF flows slow and exchange balances rise; scale back into liquidity rebuild days.
- Monitor cross-asset signals: large negative moves in AI-related equities should raise a tactical hedge flag for BTC exposure.
Risk rules for both audiences:
- Stop sizing: cap any single-trade exposure to a fraction of portfolio volatility budget (e.g., no more than 4–6% potential drawdown allocation per active trade).
- Liquidity buffer: maintain a cash/short-term liquid allocation to cover margin or rebalancing needs during a systemic event.
- Document triggers: specify which on-chain metrics (exchange balance > X, miner flows > Y BTC/day, weekly ETF net flows < Z) trigger scaling or hedging actions. Quantify these thresholds in backtests.
Tactical checklist: what to monitor daily and weekly
Daily:
- ETF creation/redemption notices and block buying events
- Miner outflows and large wallet transfers
- Exchange balance changes and funding rates
Weekly:
- Realized profit distribution shifts and realized cap vs market cap
- Options skew and put/call demand
- Cross-asset signals (Nvidia/AI ETF moves, equity vol indices)
Automate signal alerts where possible and backtest thresholds using historical consolidation episodes.
Conclusion: positioning for a ‘nervous calm’ market
The 2026 Bitcoin consolidation is best thought of as a “nervous calm”: structural demand from treasuries and ETFs coexists with fragile short-term liquidity because of concentrated flows, miner sales, and fading broad-based inflows. That combination compresses ranges while increasing the likelihood of sudden volatility spikes. Portfolio managers need to treat liquidity as an active risk, not a passive assumption. Use realized-profit lenses, monitor miner and exchange flows, and apply measured hedging or DCA strategies depending on investor time horizon.
Bitlet.app users and managers should lean into transparent liquidity indicators and clear allocation rules—these are what separate opportunistic accumulation from liquidity-driven losses.
Sources
- Bernstein’s view on tokenization and institutional themes: https://crypto.news/bitcoin-tokenization-supercycle-could-send-btc-mstr-and-iren-higher-in-2026/
- Riot miner sale coverage: https://dailyhodl.com/2026/01/08/200000000-in-bitcoin-abruptly-dumped-by-mining-giant-riot-heres-why-according-to-vaneck-executive/
- CryptoQuant CEO warning on capital inflows: https://cryptonews.com/news/capital-inflows-into-bitcoin-have-dried-up-says-cryptoquant-ceo/
- Bitcoin’s exposure to Nvidia/AI equity moves: https://cryptoslate.com/bitcoin-is-trapped-in-a-54-billion-nvidia-gamble-that-could-trigger-a-sudden-institutional-sell-off/
- BlackRock’s concentrated multi-day buys coverage: https://coinpaper.com/13615/black-rock-s-3-day-bitcoin-and-ether-buying-spree-sparks-rally-then-cooldown?utm_source=snapi