Why Five Straight Weeks of US Spot Bitcoin ETF Outflows Matter for Price Discovery and Macro Risk
Summary
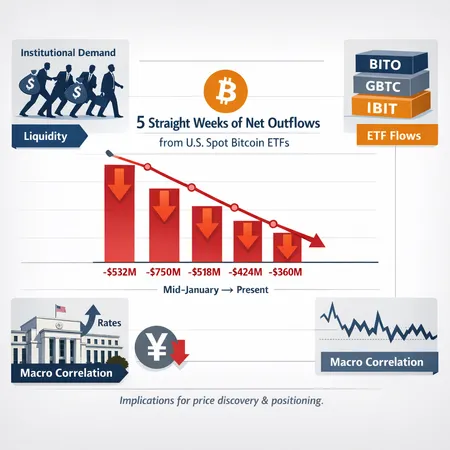
Why the five-week outflow streak is more than a headline
Since mid‑January the narrative around US spot Bitcoin ETFs has moved from steady inflows to five straight weeks of net outflows. That run is significant not because flows flip every week, but because these ETF vehicles had become a stable, institutionalized liquidity sink for BTC — and their absence changes how price gets discovered. For many traders, Bitcoin functioned as a quasi‑exchange traded asset whose marginal buyer was a set of large, mechanically rebalancing ETFs. When that mechanical demand softens, the market becomes more dependent on ad hoc liquidity from spot desks, market makers, and on‑chain counterparties. CryptoNews and CoinTribune documented the fifth consecutive week of withdrawals across US spot Bitcoin ETFs, and flow analysis has become central to short‑term sizing and risk management (see reporting on the run of outflows and fund‑level data).
The magnitude and timeline: mid‑January to today
The shift began in mid‑January when inflows slowed and then reversed into outflows. Multiple outlets confirm the five‑week streak; one analysis noted a recent weekly outflow of about $315 million, underscoring the pace of withdrawals in at least one week of the run. Reports and fund‑level summaries outline that the cumulative effect is no longer trivial: tens or hundreds of millions of dollars of net selling pressure can meaningfully change depth in the order book for large block trades. Put simply, the market has gone from digesting steady, ETF‑sized buys to absorbing intermittent, often directional selling — and that changes price mechanics. For a compact data snapshot and flow breakdown, see the reporting and tables compiled by CoinTribune and CryptoNews.
Which ETFs and investor cohorts are driving withdrawals?
Public narratives point to a mix of actor types behind the outflows. One clear theme is that institutional demand is cooling — big allocators that fronted initial inflows are either pausing new purchases or are rotating exposures elsewhere. Some of the largest US spot Bitcoin ETFs (for example, funds run by established asset managers such as BlackRock and Fidelity) have shown variability in net subscription patterns, though fund‑level dispersion is important: some vehicles still see relative stability while others experience larger redemptions.
Beyond long‑only institutional allocators, the withdrawal pattern has contributions from: authorized participants and market‑making desks managing inventory; quant and CTA strategies that reduce risk exposures amid rising macro volatility; and retail investors who may be rebalancing into cash. The net effect is less predictable ETF demand, which used to act as a reliable marginal buyer. CryptoNews frames this as cooling institutional demand, while fund‑level summaries compiled by CoinTribune help show the cross‑fund picture.
Short‑term technical impacts: price discovery and volatility
When a primary, predictable buyer steps back, three technical impacts emerge. First, price discovery becomes noisier: without ETF flows smoothing buy‑side pressure, large orders are more likely to move the intraday price and create transient dislocations between spot exchanges and derivatives markets. Second, bid‑ask spreads widen for significant sizes; market makers charge for the risk of holding longer inventory. Third, realized volatility tends to rise as liquidity dry‑ups amplify the price effect of even modest sell orders. Analysis connecting ETF outflows with near‑term BTC price action suggests these withdrawals contribute to downside pressure and faster intraday swings, as discussed in FXEmpire’s flow‑price commentary.
Those technical effects are not only local to the spot market. They also feed into derivatives: funding rates, basis between futures and spot, and options implied vol will adjust, often making hedging more expensive for managers looking to preserve directional exposure. Practically, traders should expect fatter tails on price moves and plan execution around thicker liquidity windows and limit orders rather than market prints for large fills.
How ETF flows interact with macro liquidity and cross‑asset stress
ETF flows do not operate in a vacuum. Two macro channels stand out now: fading Fed rate‑cut bets and cross‑asset stress tied to currency funding dynamics. As markets price out aggressive Fed easing, risk‑on flows that supported many risk assets — including BTC via ETFs — have softened. Commentators have connected the run of ETF outflows to a cooling of institutional appetite that coincides with less sanguine rate‑cut expectations; FXEmpire lays out how fading Fed rate‑cut bets can amplify the price impact of ETF withdrawals.
A second, more technical cross‑asset driver is the yen carry unwind. When leveraged global carry trades (borrowing low‑yielding yen to fund higher‑yield assets) unwind, margin calls and forced deleveraging can trigger exits from correlated risk assets, including BTC. CryptoSlate details how a yen carry unwind can transmit into BTC selling during liquidity squeezes, illustrating that ETF outflows can magnify the amplitude of such episodes: with fewer predictable buyers (ETFs) on the tape, transient forced selling finds less depth and causes larger price moves. In short, ETF flows are an amplifier — they can mute or magnify cross‑market shocks depending on direction.
Practical strategies for traders and portfolio managers
Below are actionable tactics tailored to intermediate investors and portfolio managers who must navigate a market with cooling ETF support:
Monitor flows as a signal, not noise. Track weekly ETF subscription/redemption reports and use them alongside futures basis and options skew to form a flow‑sensitivity view. If outflows persist, treat liquidity as structurally thinner.
Adjust execution style. For sizable trades, prefer limit orders, work orders, or TWAP/VWAP algos that respect order‑book depth. Expect higher slippage and price impact when ETF demand is absent.
Hedge selectively with options. Buying puts or constructing collars can cap downside during transient liquidity squeezes, while selling volatility is risky when implied vols are likely to reprice upward on thin liquidity days.
Size conservatively and use staggered entries. Long‑term investors can lean on dollar‑cost averaging and installment‑style purchases to avoid large single prints; platforms such as Bitlet.app provide installment options that can smooth allocation over time.
Stress test portfolios to ETF‑outflow scenarios. Model returns under several flow regimes: continued outflows, neutral flows, and resumed inflows. Include cross‑asset shocks such as a rapid JPY move or a spike in Treasury yields.
Watch derivatives signals. Rapid widening of futures basis or sustained negative funding can presage further selling pressure; use these as early warning indicators to rebalance or hedge.
What to watch next — indicators and triggers
To convert the ETF outflow story into a trading checklist, watch these gauges over the coming weeks:
- Weekly ETF flow reports and fund‑level net flows (the primary signal).
- Futures basis (contango/backwardation) across major venues — persistent contango can imply persistent selling pressure.
- Options skew and implied volatility term structure — steepening skew suggests market demand for downside protection.
- Funding rates on perpetual futures and open interest migrations between exchanges.
- Macro triggers: Fed commentary, real‑time UST yields, and yen funding stress indicators that can catalyze correlated deleveraging.
If ETF flows re‑turn to net inflows, expect a swift improvement in depth and narrower spreads; if outflows persist, prepare for a higher‑volatility regime where microstructure matters more than macro narratives alone.
Bottom line
Five straight weeks of net outflows from US spot Bitcoin ETFs matter because they remove a steady, predictable source of buy‑side liquidity and institutional demand. The effects are practical: noisier price discovery, wider spreads, greater volatility, and stronger sensitivity to macro shocks like fading Fed easing and currency carry unwinds. Intermediate investors and portfolio managers should respond with clearer flow monitoring, conservative sizing, and tactical hedges — not panic. That combination preserves optionality until the ETF buyer returns or macro liquidity conditions normalize.
Sources
- Spot Bitcoin ETFs log fifth straight week of outflows as institutional demand cools — CryptoNews
- Five consecutive weeks of net outflows for Bitcoin ETFs — CoinTribune
- Bitcoin slides as weekly ETF outflows hit $315M — FXEmpire
- Yen carry trade unwind and margin calls’ link to Bitcoin selling — CryptoSlate