What Tether’s Rare USDT ‘Liquidity Signal’ Means for a Bitcoin Market Bottom
Summary
Why this USDT liquidity signal matters now
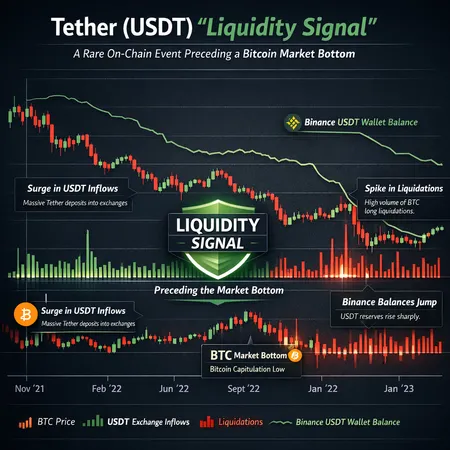
A rare USDT liquidity pattern — described by on-chain analysts as a concentrated inflow or repositioning of Tether liquidity that historically coincided with meaningful price turns — has been flagged again during a recent Bitcoin sell-off. That sell-off pushed BTC under $65k and triggered roughly half a billion dollars in liquidations in short order, so the signal can't be interpreted in isolation. Reports from Decrypt and crypto.news document the liquidation cascade and its trader-level impacts, while on-chain exchange flows show rising BTC balances on Binance that complicate any bottom call.
The goal of this piece is practical: explain how stablecoin liquidity metrics are constructed, summarize the historical precedent for the signal, map how it interacts with forced liquidations and exchange wallet flows, and give intermediate traders and portfolio managers concrete ways to interpret and act on the signal without overreaching.
How stablecoin on-chain liquidity metrics work
At base, a stablecoin liquidity metric attempts to quantify available buying power denominated in USD-equivalents on-chain — primarily USDT for many crypto markets. Common inputs include the supply of USDT on exchange wallets, large transfers between custody and trading desks, on-chain balance concentration among known market makers, and net mint/burn flows. The intuition: if a lot of USDT is sitting on exchanges or moving toward exchange wallets, there is the capacity for buyers to absorb selling pressure.
But capacity ≠ intent. A rise in exchange USDT balances could reflect custodial rebalancing, OTC desks hedging, or liquidity provisioning ahead of derivatives settlement. Good liquidity metrics therefore combine quantity (how much USDT) with velocity and provenance (where did it come from, and how quickly it moves into or out of trading wallets). Metrics traders watch include exchange USDT balance trends, large wallet-to-exchange transfers, minting events on known Tether issuers, and cross-checks with futures open interest and funding rates.
What the metrics tell you — and what they don’t
- They show potential buying firepower. That helps estimate how much selling the market could theoretically absorb without price discovery dislocating.
- They do not guarantee activation. USDT can sit idle or be blocked in custody arrangements.
- Combine on-chain stablecoin metrics with orderbook depth, open interest, funding rates, and exchange BTC balances for a complete picture.
The historical precedent: the one prior occurrence
Reports spotlighting this specific “USDT liquidity signal” note that it has appeared only once before, and that prior instance aligned with a strong multi-week bottom in BTC. The claim — laid out in the primary analysis — argues the pattern showed a concentrated increase of exchange-accessible USDT combined with a drop in active selling pressure, after which buyers stepped in and the market recovered.
That precedent is suggestive but not dispositive. Markets evolve: liquidity providers change, derivatives product mix shifts, and macro conditions differ between cycles. Use the prior example as a lens, not a rule. The signal is informative — it raises the probability of buyer absorption — but it must be weighted against contemporaneous data such as forced liquidations and exchange flows.
How the signal interacts with forced liquidations and exchange wallet flows
Forced liquidations turn potential buying power into actual selling pressure. The recent BTC dip under $65k produced roughly $500m in liquidations, per reporting, with a high concentration in short-term leveraged positions. That selling can swamp stablecoin-provided capacity if it occurs too quickly.
At the same time, exchange BTC balances matter. CoinDesk data shows BTC balances on Binance have risen to levels not seen since late 2024, indicating more coins are domiciled on a major orderbook. Higher BTC balances on exchanges increase the risk that those coins can be sold quickly into a rally, adding supply-side pressure precisely when buyers are supposedly poised with USDT. In other words: even if USDT sits ready, a large pool of BTC on exchange wallets can still flip momentum by increasing available sell liquidity.
Context matters: if you see the USDT signal but also a spike in exchange BTC balances and heavy liquidations (as documented by Decrypt and crypto.news), the setup looks more like a short-covering bounce with elevated vulnerability than a durable institutional bottom.
Interpreting the signal: false bottom vs durable support
How do you tell which outcome you’re facing? Use a checklist approach:
- Confirm activation: Are USDT balances moving from custody to active exchange trading wallets, or are they parked in cold/OTC custody? Active wallet flows matter more.
- Match timing to selling pressure: If USDT arrives after liquidation-driven selling subsides, that’s more constructive. If it arrives during peak forced selling, it may only provide transient orderbook relief.
- Check open interest and funding: Falling open interest with an inflow of USDT suggests deleveraging + fresh buying — a healthier bottom. Rising open interest plus USDT inflows suggests more leverage can drive renewed moves either way.
- Watch Binance balances: rising BTC on Binance while USDT inflows increase suggests both sides may be gearing up; that increases volatility and the chance of a false bottom.
- Look for follow-through liquidity: durable support typically coincides with improving bid-side depth across multiple venues, cooling liquidation cascades, and sustained declines in selling velocity.
If the checklist mostly ticks green, treat the signal as a higher-probability bottom. If several red flags persist (large exchange BTC balances, persistent liquidations, rising open interest), consider the signal as a potential short-term reclaim point rather than a durable support level.
Actionable risk-management steps for traders and portfolio managers
Reduce leverage and cap notional exposure. During events with heavy liquidations, leverage magnifies losses. Cut leverage first, ask questions later.
Stagger entries (scale in). Rather than a full-sized market buy when the signal appears, use a laddered approach: commit a fraction at near-market, tranche more on defined improvements in orderbook depth or lower realized volatility.
Use options to hedge asymmetry. Put spreads or collars can limit downside while allowing upside participation. For managers, structured hedges reduce tail-risk without fully exiting beta exposure.
Convert a portion of dry powder into limit orders across exchanges. If you believe the USDT signal indicates buying capacity, place layered bids instead of a single market order to avoid slippage and front-running.
Monitor correlated indicators continuously: funding rates, open interest, exchange BTC balances, and large stablecoin transfers. Tie automated alerts to thresholds so you can act faster than discretionary monitoring allows.
Maintain liquidity buckets and drawdown rules. Decide beforehand how much you will allocate to opportunistic buying versus capital reserved for hedging or rebalancing.
Consider counterparty exposure and custody provenance. Not all USDT is equally deployable: funds held in regulated custodians vs opaque pools behave differently under stress.
Practical example: a sample playbook
- Situation: USDT liquidity signal appears, BTC down 8% intraday, Binance BTC balances rising, $500m in recent liquidations.
- Defensive move (immediate): Reduce leverage to target maximum 1.5x; hedge 25% of exposure with a put spread that caps cost.
- Opportunistic move (if signal confirms): Deploy 30% of planned buy size at layered limit bids; add another 30% if funding rates normalize and orderbook depth improves for 12+ hours.
- Fail-safe: If open interest ramps >15% or exchange BTC balances keep climbing for 24 hours, exit hedged positions and re-evaluate.
This exercise balances capital protection with measured entry — it’s appropriate for portfolio managers who need to defend AUM while capturing asymmetric upside.
Monitoring tools and practical tips
Use multiple data sources rather than relying on a single indicator. On-chain dashboards that track Tether flows are useful, but pair them with derivatives analytics (open interest, funding rates) and exchange wallet tracking. Read primary market reporting — for example, the original analysis of the USDT signal — in parallel with liquidation coverage (Decrypt, crypto.news) and exchange balance notes (CoinDesk) to build an evidence-weighted view.
For operational execution, platforms that offer multi-exchange order routing and limit-order liquidity snapshots reduce slippage. Bitlet.app is one example of an ecosystem that provides crypto services you might integrate into a broader workflow rather than a substitute for analytical confirmation.
Final takeaways
Tether’s rare USDT liquidity signal is a meaningful piece of information: it raises the odds that there is available buying power on hand. But on-chain liquidity is only one slice of the market-picture pie. The signal must be read against forced liquidations, exchange BTC balances (notably Binance), derivatives metrics, and institutional behavior. For intermediate traders and portfolio managers, the practical path is to treat the signal as a conditional positive — confirm with supporting indicators, reduce leverage, stagger entries, and use option hedges when appropriate.
In short: the USDT signal can point you toward opportunity, but capital preservation — not bravado — should dictate execution. Use the checklist above, automate alerts on key metrics, and assume the market can surprise you a second time.
Sources
- BeInCrypto — Bitcoin USDT liquidity signal market bottom risk
- Decrypt — Bitcoin’s dip under $65K pushes crypto liquidations to $500M
- CoinDesk — Bitcoin balances on Binance hit highest since November 2024
- Crypto.news — Bitcoin dips under $64.5K as $500M liquidations hit 140K traders
For related reading on market dynamics and liquidity indicators, see coverage of Bitcoin and DeFi.