XRP Capitulation or Rebound? Diagnosing the $1.9B Realized‑Loss Spike and What Comes Next
Summary
Executive snapshot: what happened to XRP
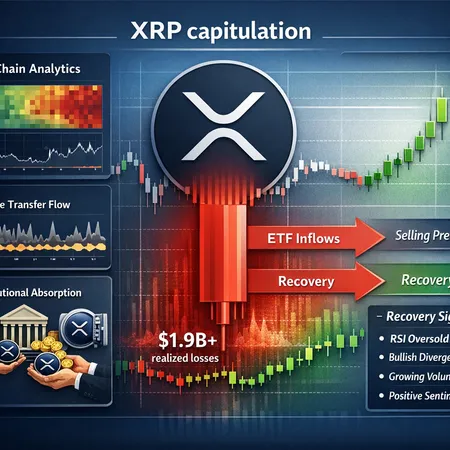
Last week on‑chain analytics flagged a dramatic event: XRP posted its largest weekly realized‑loss spike since 2022, with losses roughly in the $1.9 billion range. That figure — quantified by multiple on‑chain trackers and reported industrywide — captures sellers crystallizing losses as they exit positions. Large realized‑loss spikes are noisy by themselves, but they are a classic hallmark of capitulation: a phase where weak hands sell en masse, often at the bottom of a drawdown.
This piece walks through what the data actually implies, how past capitulations have unfolded across crypto, why institutional absorption and ETF flows matter, and how active traders and on‑chain analysts can translate the evidence into risk‑adjusted trade plans. For many market participants — from quant desks to retail traders using platforms like Bitlet.app — the key is separating emotional storytelling from measurable signals.
Reading the on‑chain signal: realized losses and why size matters
Realized‑loss spikes measure the USD value difference between what sellers paid for coins and what they received when selling. A single large weekly spike indicates concentrated selling and high conviction exits. Reporting from Santiment and follow‑ups in trade media documented that XRP’s weekly realized losses reached the largest level seen since the 2022 capitulation window; other outlets pegged the week’s total at about $1.93 billion, corroborating the scale of the move (Cryptopolitan and U.Today).
Why does magnitude matter? Small, isolated realized‑loss upticks can reflect routine profit‑taking or traders rotating between altcoins. But a near‑$2B weekly loss number for a single asset indicates either broad retail capitulation or large cash‑out events by bigger holders. That size tends to clear a substantial amount of marginal supply — the very supply that suppresses rallies — and it changes the market structure.
Market structure after capitulation: a repeatable sequence
Capitulation is messy, but it often follows a recognizable arc: 1) concentrated selling and realized losses spike; 2) exchange balances and retail orderflow thin as sellers exhaust; 3) stronger hands and institutions begin absorbing cheap supply; 4) price stabilizes and volatility compresses; 5) once accumulation reaches a threshold, a squeeze or renewed demand triggers a strong rebound. Not every realized‑loss spike ends this way, but the pattern is common enough to be actionable.
Historical parallels are helpful but imperfect. In prior crypto capitulation events (late 2018 through early 2019, or mid‑2022), large realized‑loss windows preceded durable rallies once liquidity was absorbed and macro conditions stabilized. The key differentiator is who absorbs the supply: if weak hands simply move from spot to derivatives or off‑exchange holdings, the market can remain fragile; if institutions or long‑term allocators pick up coins, structural recovery becomes more likely.
Evidence for institutional absorption and a shift in sell pressure
Recent reporting suggests institutions are increasingly responsible for absorbing the supply after the XRP washout. Coverage noted declines in panic selling and observed that larger players appear to be taking inventory — a signal that could tilt the narrative from forced sell to deliberate accumulation (Ambcrypto). On‑chain markers consistent with this thesis include declining exchange balances, concentration of inflows to a smaller set of cold wallets, and fewer small‑value sell transactions.
Institutions typically buy differently than retail: they accumulate off‑exchange or via OTC desks, which shows up as lower exchange flows but increasing balance in custody or known institutional addresses. If these balance‑and‑flow patterns persist — combined with shrinking realized‑loss week‑over‑week — the market has a structural chance to rebuild.
ETF inflows and the mechanics of flow‑driven reversals
ETF narratives matter because they create a predictable, sticky demand profile. Even if XRP currently lacks a dedicated spot ETF, the broader market has been conditioned by spot ETF inflows (e.g., Bitcoin ETFs) that reduce available float and compress liquidity, causing price reactions when demand outpaces remaining supply. ETF‑driven buying tends to widen bid depth and can reverse recent selling pressure by providing a steady, large‑scale buyer.
The operational link is simple: when institutional vehicles or ETFs draw capital into crypto, trading desks are forced to source coins, often pulling from exchanges and OTC pools. That sourcing reduces exchange liquidity, which in a low‑supply environment can magnify rebounds. Combine that with institutions absorbing XRP token supply, and the thesis for a rebound strengthens — though it’s contingent on continued demand and macro stability.
Signals to watch that favor a rebound over a drawn‑out downtrend
Focus on converging evidence rather than any single metric. Key actionable on‑chain and market signals include:
- Exchange balance trends: sustained declines in XRP on exchanges suggest less immediate sell liquidity.
- Realized losses trend: a sharp spike followed by rapid decline in weekly realized losses implies sell pressure has run its course.
- Accumulation by larger wallets: rising balances in non‑exchange or known institutional wallets indicate absorption.
- Inflow/outflow reversals: higher inflows to custody/OTC channels and lower small‑ticket sell transactions are constructive.
- Volume‑price divergence: price stabilization on declining volume after a capitulation often precedes a relief rally.
If several of these signals align, the case for a rebound strengthens. Ambiguity persists if realized losses remain elevated while exchange balances increase — that would signal continued distribution, not absorption.
When large realized losses have preceded strong rallies: context not causation
There are clear cases where big realized‑loss windows came before sharp recoveries. The logical explanation is that capitulation clears liquidity and forces position re‑rating: once the weak hands are gone, remaining holders and new entrants can push price rapidly as buy pressure outstrips the reduced supply. But this is context‑dependent — macro liquidity, derivatives structure, and enforceable on‑chain supply all matter.
A practical rule: large realized losses are a necessary but not sufficient condition for a durable rally. They create the environment for upside if absorption follows. For traders, that means watching both the quantity of losses and the quality of who holds the coins afterward.
Trading strategies for risk‑adjusted entries during capitulation
Below are pragmatic tactics for active traders and on‑chain analysts seeking evidence‑based trade ideas around extreme loss events. Each strategy assumes you size positions relative to conviction and use stop‑losses or hedges.
- Staged accumulation (scaling in)
- Rationale: avoid catching a falling knife. Start with a small base allocation when realized losses spike and add as key signals (exchange balances down, accumulation wallets up) confirm.
- Example: Buy 25% of intended size at current levels, 25% if exchange balances fall 5–10%, 50% when a realized‑loss rolling average declines.
- Volatility‑weighted DCA
- Rationale: use volatility to amortize entry price. Increase dollar‑cost averaging size as realized volatility falls or as on‑chain accumulation metrics improve.
- Event‑driven swing with options hedge
- Rationale: buy a directional spot or futures position and hedge downside with put options or inverse futures to cap tail risk.
- Practical: purchase spot exposure for upside while buying out‑of‑the‑money puts or establishing a short futures position sized to limit drawdown.
- Supply‑saturation trade
- Rationale: if institutions are absorbing supply (off‑exchange), attempt to front‑run accumulation by tracking large withdrawals to custody and entering when exchange outflows accelerate.
- Risk: misreading OTC activity — always confirm with multiple on‑chain indicators.
- Mean‑reversion scalping during volatility compressions
- Rationale: after capitulation, volatility often compresses before a breakout. Short‑term traders can capitalize on intraday mean reversion while maintaining strict stop discipline.
- Risk parity sizing and portfolio tilt
- Rationale: give capitulation trades a small, volatility‑adjusted weight within a diversified portfolio. Limit any single trade to a predefined percent of portfolio volatility budget.
Risk management and scenario planning
Capitulation trades require robust playbooks. Worst‑case: realized losses continue to climb and macro liquidity tightens, producing sustained downtrends. Best‑case: supply is absorbed, volume normalizes, and a rapid relief rally follows. Prepare for both by:
- Predefining loss tolerances and hedges.
- Using on‑chain alerts to automate position scaling when signals confirm.
- Avoiding leverage unless you have a high‑confidence thesis and tight stop rules.
- Stress‑testing positions for multi‑day funding and margin scenarios.
Remember that on‑chain evidence is powerful but not omniscient; regulatory actions, exchange outages, or sudden macro shocks can invalidate patterns.
Practical checklist for traders and on‑chain analysts
Before increasing exposure, validate at least three of these:
- Weekly realized losses have peaked and are trending down.
- Exchange balances are declining and large‑wallet (non‑exchange) balances are stable or increasing.
- Small‑ticket sell transactions have dropped materially.
- Market microstructure (order books) shows thicker bids at multiple price levels.
- Broader crypto demand signals (ETF flows or institutional buying narratives) are supportive.
If the checklist is met, consider staged entries with hedges; otherwise maintain defensive sizing.
Conclusion: capitulation sets the table — but buyers decide the meal
The $1.9B realized‑loss spike in XRP is an important on‑chain alarm. By itself, it marks a severe loss window and a clearing of marginal sellers. The pathway to a rebound requires confirmation: declining realized losses, shrinking exchange inventories, and evidence that institutions or persistent buyers are absorbing the freed supply. ETF‑style flows in the broader market have changed how capital sources interact with exchange liquidity, and that dynamic can accelerate recoveries when absorption is under way.
Traders should treat the event as a structural opportunity rather than a guaranteed signal. Combine the quantitative on‑chain metrics discussed here with disciplined risk management and staged position sizing to convert a messy capitulation into an asymmetric trade. For analysts and traders building alerts, prioritize multi‑signal confirmation and use platforms and custodial flow data to triangulate institutional absorption.
Sources
- Santiment and on‑chain reporting summarized by U.Today: https://u.today/xrp-records-largest-on-chain-realized-loss-spike-since-2022?utm_source=snapi
- Deep dive on realized losses (≈$1.93B) from Cryptopolitan: https://www.cryptopolitan.com/xrps-realized-losses-surge-to-1-93b/
- Coverage on declining panic selling and institutional absorption from AMB Crypto: https://ambcrypto.com/xrp-panic-selling-ends-as-institutions-absorb-supply-is-recovery-next/
For many traders the next steps are clear: watch the on‑chain flow, confirm institutional footprints, and size positions to withstand further noise. And remember — measuring market structure matters more than reacting to a single headline. Whether this week’s realized‑loss spike becomes the bottom or merely a painful clearing episode depends on how demand responds. For active traders and analysts seeking evidence‑based ideas around extreme loss events, that response is the trade.
For more on how on‑chain signals feed trade decisions, explore the XRP coverage and related insights into market structure across crypto.