Reconciling Bitcoin's Mixed Signals: Liveliness Up, Corporate Risks Rising
Summary
Introduction: a market telling two different stories
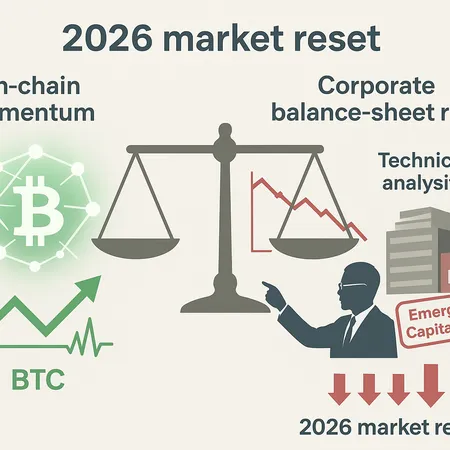
Bitcoin is telling two stories at once. On-chain telemetry shows renewed activity and rising liveliness, which bulls point to as a sign the cycle still has legs. At the same time, respected technical analysts and the domino effects of corporate treasuries are waving red flags — think bearish weekly structures and emergency balance-sheet moves by major holders like MSTR.
This article will unpack the liveliness signal, place Peter Brandt’s weekly caution in context, examine the corporate-treasury fallout from Michael Saylor’s playbook and MicroStrategy’s rapid capital raise, then synthesize what all of this means for possible 2026 price regimes. The goal is a reconciled view for intermediate traders and institutional researchers who need nuance — not slogans.
What the liveliness metric is saying — and why bulls care
Liveliness has recently ticked higher, and analysts are interpreting that as more coins becoming active after periods of dormancy. CryptoNews reported that the liveliness indicator’s rise is being read as a hint the bull cycle may not be over (CryptoNews).
Put simply: higher liveliness means coins that were inactive are moving, suggesting renewed distribution or accumulation depending on context. In a classic bull transition, increasing on-chain activity can precede price discovery because accumulation, spending, and new flows are all visible on-chain. For traders watching BTC, rising liveliness complements other momentum metrics (exchange inflows/outflows, realized cap trends) as evidence the market has not fully capitulated.
That said, liveliness is not a price oracle. It captures behavior, not intent. Old coins moving can be accumulation, but they can also be profit-taking by long-term holders or rebalancing by corporates. Interpreting the signal requires cross-checks with exchange activity, derivatives open interest, and order-book dynamics.
The technical counterpoint: Brandt's bearish weekly structure
Technical analysis still matters — especially for institutional desks that trade on multi-week framing. Legendary trader Peter Brandt published a bearish weekly chart for BTC that outlines lower landing zones and a structure that, if respected, undermines a simple bullish narrative (coverage summarized here: U.Today).
Brandt’s take is a reminder that weekly structure and macro liquidity can impose constraints on price even when on-chain activity looks constructive. Technical breaks on the weekly timeframe can trigger large option flows, forced liquidations in derivatives, and institutional de-risking — all mechanisms that can make a rising liveliness metric coincide with sharp price corrections.
So: when a respected weekly-based trader draws a bearish map, risk managers should pay attention. It’s not that Brandt’s structure invalidates on-chain momentum; it means on-chain momentum must contend with macro-technical realities. The interaction often determines the speed and amplitude of moves.
Corporate treasuries and the Saylor effect: contagion risk
One of the most underappreciated vectors of market fragility is corporate treasury exposure to BTC. Michael Saylor’s public treasury model — buy and hold BTC as a store of value — was emulated widely. Recent analysis shows that many public companies that followed Saylor’s playbook have seen severe equity declines as BTC volatility translated into balance-sheet pain (CryptoNews analysis).
MicroStrategy (ticker: MSTR), the poster child for corporate Bitcoin adoption, recently raised roughly $1.44 billion in what reporters framed as an emergency capital infusion to fortify its position amid market pressure (AmbCrypto). That raise tells two stories at once: confidence in propping up a treasury-based strategy, and the existence of acute financing needs that surface when share price and collateral values wobble.
Corporate treasury holdings create a feedback loop. Large on-balance-sheet BTC allocations make equity prices sensitive to BTC moves; falling equity or a stressed market can force equity raises or sales that, if large enough, add supply pressure to BTC. This is corporate balance-sheet risk materializing as market risk.
How on-chain momentum and corporate balance-sheet risk can coexist
These narratives are not binary. Consider a timeline:
- On-chain liveliness rises as retail and some institutions re-engage with BTC. That can lift price and create optimism.
- Concurrently, corporations with concentrated BTC exposure face mark-to-market losses. To stabilize, they might issue equity or raise debt — actions that can be perceived negatively by markets.
- If corporate actions are large or poorly timed, they can inject supply or trigger sentiment shifts that outweigh the modest buying from renewed on-chain activity.
In plain terms: on-chain bullishness matters for trend formation, but corporate balance-sheet events can be shock amplifiers. That interplay increases volatility and the probability of regime switches.
For 2026, think in conditional regimes rather than a single forecast:
Bull continuation scenario: sustained demand (spot accumulation by retail, APs, long-only funds) plus improving macro liquidity keeps BTC above key structural levels. Liveliness reflects genuine accumulation and institutional adoption solidifies. MSTR and similar names stabilize after recapitalizations. This path could support new all-time highs.
Range-bound / consolidation scenario: on-chain activity remains elevated but not dominant; corporate sales and episodic technical breakdowns grind price sideways. Many traders get whipsawed as momentum and selling alternate.
Market reset scenario: a sequence of corporate liquidity events (forced sales or dilutive raises) coincides with a decisive weekly technical break, causing a deeper correction. Liveliness might remain high during the reset — coins move — but the movement is distribution rather than accumulation.
Probabilities hinge on three inputs: real-money flows into BTC (ETFs, custody demand), macro liquidity / rates, and the size/timing of corporate balance-sheet moves. Institutional researchers should model joint tail risks rather than treating on-chain and corporate signals independently.
Tactical takeaways for intermediate traders and institutional researchers
Stress-test corporate exposures: any portfolio with correlated equity&BTC exposures must run scenarios where MSTR-like events occur. Model equity dilution, margin liquidity, and potential forced sales.
Don’t rely on one signal: combine liveliness with exchange flows, futures funding rates, open interest, and weekly technical structure. A rising liveliness plus tightening funding and falling exchange reserves is more convincing.
Size and hedge: given higher odds of volatility, reduce position sizes or use protective hedges (options collars, short-dated puts sized to the biggest plausible corporate unwind).
Monitor filings and capital raises: Schedules of equity raises, convertible issuance, or debt covenants can be early-warning signs. MicroStrategy’s $1.44B action is a textbook event to watch for similar firms.
Watch market microstructure: an orderly rally requires liquidity at the top of the book. If liquidity is thin and liveliness is rising, a single large corporate sale could cause outsized moves.
Keep an eye on narrative contagion: reputational hits to the “corporate treasury” story can shift retail sentiment quickly. Platforms from custody providers to exchanges matter — and yes, ecosystem tools such as Bitlet.app that offer varied access and settlement options are part of that plumbing.
Final synthesis: practical framing for 2026 regimes
Rising liveliness is an encouraging sign that activity and potential demand are returning to BTC. It should not be dismissed. But neither should the clear technical warnings and the corporate-treasury fault lines exposed by the Saylor playbook and MicroStrategy’s recent raise. The prudent market view for 2026 is conditional: expect higher volatility and regime uncertainty, with outcomes hinging on capital flows, macro liquidity, and whether corporates that adopted BTC can shore up balance sheets without adding large sell-side pressure.
For institutional researchers and intermediate traders, the takeaway is simple and slightly uncomfortable: prepare for multiple plausible futures, use layered signals (on-chain, technical, corporate), and keep risk controls tight. That reconciled approach is more useful than declaring a single, confident narrative.
Sources
- CryptoNews — Bitcoin liveliness indicator rises: https://cryptonews.com/news/bitcoin-liveliness-indicator-rises-hinting-the-bull-cycle-may-not-be-over/
- U.Today — Peter Brandt’s bearish weekly chart: https://u.today/legendary-trader-peter-brandt-reveals-his-bitcoin-price-target-and-bulls-will-not-like-it?utm_source=snapi
- CryptoNews — Michael Saylor’s playbook backfires analysis: https://cryptonews.com/news/michael-saylors-bitcoin-playbook-backfires-on-100-companies/
- AMB Crypto — MicroStrategy raises $1.44B: https://ambcrypto.com/microstrategy-raises-1-44b-to-get-rid-of-bitcoin-fud-what-does-this-mean/
For further reading on market indicators and intermediate trading frameworks, see how on-chain metrics and technicals are often combined in institutional research, and note that discussions around Bitcoin continue to shape narrative-driven flows.


