Solana’s Price Recovery and How NEAR-on-Solana Could Shift Cross-Chain Liquidity
Summary
Quick context: why this matters now
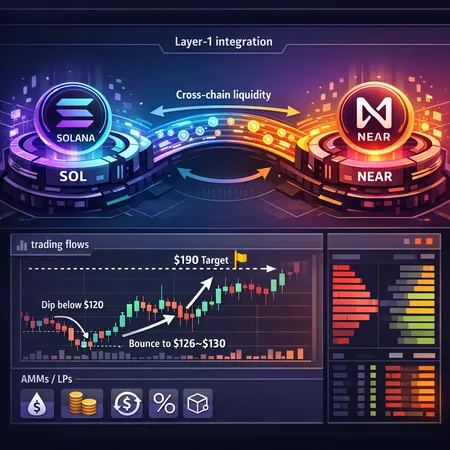
Solana’s price action over the last few weeks has been notable for its volatility and a rapid swing in trader sentiment. After dipping below $120—an environment that saw activity cool on the chain—SOL staged a bounce toward the $126–$130 area. That short-term price recovery matters for DeFi traders because the health of on-chain liquidity and cross-chain integrations will shape how much of that move is structural versus temporary.
For many active market participants, Solana remains a key Layer‑1 to watch: low fees and high throughput attract AMM liquidity and arbitrageurs, and new Layer‑1 integrations can re-route token flows in surprisingly short order.
Short-term technical recovery: the dip and the bounce
Solana briefly fell below $120 during a period when on-chain activity cooled, pressure that translated into price weakness observed across analytics platforms and reporters at the time. Coverage of the dip highlighted traders pulling back and certain liquidity providers reducing exposure as spreads widened noted in reporting on the dip below $120.
The rebound toward the $126–$130 band—covered in market analysis that points to renewed trader interest and speculative rotation—was supported by fresh inflows into Solana-based markets and the return of AMM activity after a brief lull. News outlets that tracked the recovery point to both on-chain metrics and renewed market narratives as drivers behind the bounce see this roundup on the recovery.
What the technicals imply
A recovery into the $126–$130 area is a short-term validation of buyer interest; it does not, on its own, negate broader macro or sector risks. Traders should treat the move as an opportunity to confirm liquidity depth: watch slippage on SOL pairs, DEX volumes, and whether centralized exchange order-books are thickening on bids above $125.
The $190 thesis: bull case, bear case, and the caveats
An analyst recently outlined a scenario where SOL could rally toward $190, a move driven by renewed risk appetite, increased staking rewards traction, and important network-level developments. That bullish path is real in a contained environment: if on-chain volumes, TVL, and cross-chain integrations accelerate concurrently, the momentum could compound analyst discussion summarized here.
But there are important caveats. The bull case depends on sustained active flows rather than short-lived headline-driven spikes. Liquidity concentration (large whales or a handful of pools supplying most AMM depth), weak derivatives funding beneath the surface, and macro sell pressure could all prevent a clean run-up. The same analyst coverage that mentions $190 also warns about structural limitations and the possibility that gains stall without deeper liquidity.
Balanced view for strategists
- Bull triggers: accelerating DEX volumes, larger AMM pool depths, cross‑chain assets bringing fresh liquidity, and positive derivatives sentiment.
- Bear triggers: fragmented liquidity across chains, low bridge throughput, rising exchange outflows, or renewed macro risk that drains risk-on capital.
NEAR launches on Solana: a case study in Layer‑1 integration
NEAR’s decision to launch on Solana is an instructive example of how a Layer‑1 integration plays out in practice. The announcement created immediate market interest because it promises new trading pairs, increased composability for NEAR-based assets, and the potential for NEAR liquidity to sit inside Solana AMMs and order-books rather than being siloed on the original chain reported launch details.
This is not just theoretical: when a protocol makes its assets available on a second L1, several things happen simultaneously. Traders get new venues for exposure; arbitrageurs test price parity between chains; AMMs that list the token draw in swaps, fees, and LP incentives. If executed cleanly, this can increase the effective liquidity of both chains for that token.
How NEAR-on-Solana could reshape trading flows
- New AMM pools on Solana could attract stablecoin pairs and speculative pairs, bringing swap volume that benefits underlying DEXs.
- Bridges will move NEAR supply onto Solana in wrapped form; early inflows determine whether liquidity is deep enough for large trade execution without extreme slippage.
- Market makers may reallocate capital to Solana venues to capture tighter spreads and higher fee yield, which can shift trading flow away from NEAR-native markets.
Liquidity migration mechanics: what to watch
Cross-chain liquidity migration is messy and often non-linear. Here are the high-signal metrics traders and strategists should monitor closely:
- Bridge flows and net bridging direction: active monitoring of how much NEAR (and wrapped-NEAR) is bridged to Solana indicates initial liquidity appetite.
- Wrapped supply and on-chain token distribution: look at the number of unique holders and concentration of wrapped NEAR on Solana.
- AMM pool depths and slippage curves: assess practical execution cost for block-sized trades.
- DEX volume and fee changes: rising swap fees and volumes on Solana hint at a durable migration.
- Open interest and funding rates on perpetual desks: derivatives markets often lead cash moves; sustained negative or positive funding will signal directional pressure.
- Staking ratio and liquidity lockup on SOL: higher staking can reduce available circulating liquidity and magnify price moves.
Watching these metrics together gives a clearer picture than any one indicator alone. For example: a spike in bridged NEAR without corresponding AMM depth suggests temporary arbitrage trades rather than durable liquidity migration.
Tactical implications for DeFi traders and protocol strategists
Short-term traders: use smaller position sizes until you see consistent AMM depth and cross-chain arbitrage narrowing price gaps. A breakout above $130 on heavy DEX and CEX volume could justify scaling in. Conversely, sharp inflows to a bridge paired with thin Solana AMMs is a classic setup for slippage-driven liquidation cascades.
Liquidity providers and strategists: consider incentivizing deeper pools on both chains to prevent fragmentation. If your protocol benefits from cross-chain flows, analyze bridge custody models and the ease of redemption; trust and UX will determine whether liquidity stays or returns.
Arbitrageurs: be ready for transient spreads between NEAR markets across chains—those spreads will compress quickly if bridges and relayers operate smoothly. Speed and bridge cost efficiency will decide arbitrage margins.
A practical note: platforms like Bitlet.app that offer installment buying can help some traders dollar-cost average into volatile setups instead of timing exact tops and bottoms.
Final takeaways
Solana’s recent recovery into the $126–$130 band is an encouraging sign of renewed interest, but the path to a structural rally (the $190 scenario) requires meaningful, sustained increases in liquidity and cross‑chain activity. NEAR’s launch on Solana is an active experiment in Layer‑1 integration: it can deepen markets, but it also risks fragmenting supply if bridges and AMMs don’t mesh well.
For DeFi traders and protocol strategists, the watchlist is clear: bridge flows, wrapped supply, AMM depth, DEX volumes, and derivatives sentiment. Those signals will tell you whether liquidity is migrating in a way that supports durable price appreciation—or whether it’s just short-term rebalancing and arbitrage.
Sources
- https://www.newsbtc.com/news/solana/solana-price-approaches-130-whats-behind-the-recent-surge/
- https://www.newsbtc.com/news/analyst-says-solana-price-could-rally-to-190-soon-but-theres-a-catch/
- https://thecurrencyanalytics.com/altcoins/near-protocol-launches-on-solana-sparking-market-interest-230875
- https://ambcrypto.com/solana-dips-below-120-as-activity-cools-yet-this-group-leans-in-why/