Why XRP’s January Strength Matters: Whale Accumulation, ETF Inflows and the Breakout Setup
Summary
Executive snapshot
XRP’s January strength isn’t just another headline pump — the move has on‑chain teeth. Large withdrawals from centralized venues, a clear jump in exchange and chain volume, and sustained spot‑ETF demand combine to create a structural supply shock that can support a breakout. For intermediate traders and macro analysts this is a live case study of how token‑specific ETFs and concentrated whale accumulation converge to change risk/reward dynamics.
For many traders, XRP remains a token where on‑chain signals matter more than social chatter. The rest of this piece walks through the evidence, explains how ETF mechanics can tighten inventory, outlines technical triggers for a believable breakout versus a failed rally, and offers practical trading and position‑sizing rules adapted for 2026.
On‑chain picture: whale accumulation and exchange flows
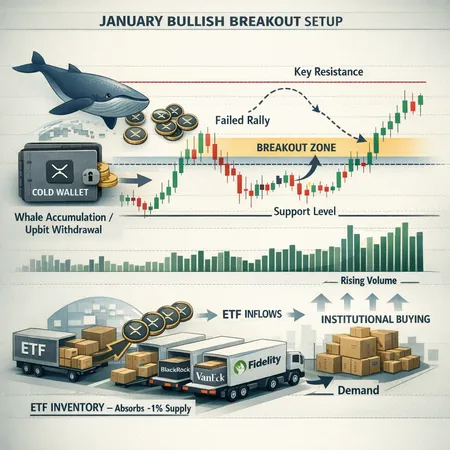
On‑chain data from January points to two complementary realities: rising transactional volume and targeted large transfers. A headline example is the 4.8M XRP withdrawal from Upbit reported in January — a transfer big enough to register as whale accumulation rather than routine exchange rebalancing. TheNewsCrypto covered that withdrawal and linked it to strengthening bullish sentiment and accumulation signals.
Large, deliberate outflows from exchanges matter because they remove supply that would otherwise be available for selling. When withdrawals cluster around the same timeframe as rising on‑chain throughput and increased in/outflow imbalances, you get a classic precursor to lasting price appreciation: fewer sell orders on the books and more coins sitting in custody or cold wallets.
Why watch exchange flows specifically? Exchanges are the marginal liquidity providers for most retail and some institutional flows. A sustained trend of net withdrawals from exchanges — especially when paired with rising deposit activity into custodial wallets for ETF issuers or institutional cold storage — reduces available circulating supply. That’s the on‑chain backbone behind the market narrative of whale accumulation and sets the stage for an ETF‑driven squeeze.
Spot‑ETF mechanics and why issuers’ hunt for inventory matters
Spot ETFs that hold the underlying token create persistent, structural demand: every net inflow into the ETF typically requires the manager to buy the asset (or create shares via in‑kind creation) to back those shares. Recent reporting suggests ETF inflows into XRP are meaningful at scale — one analysis put ETF inflows at or near absorbing ~1% of XRP’s circulating supply, a nontrivial figure for a single instrument in a compressed timeframe.
When several issuers compete for limited inventory the practical effect is amplified. u.Today highlighted the two‑market dynamic (open market vs. spot ETFs) with roughly $1.37B AUM in play and net inflows creating a tug‑of‑war over available tokens. That competition can push dealers and authorized participants to source inventory on spot venues, OTC desks, and even directly from large holders — raising buying pressure and widening the gulf between bid and ask at the market level.
A key nuance: ETF mechanics vary by issuer. Some rely more on in‑kind creations (direct swaps of tokens for ETF shares), others lean on market purchases with dealer intermediation. During periods of heavy inflow, the path of least resistance often becomes open‑market purchases, which show up as real net demand and therefore higher spot prices.
The broader macro context matters too. Crypto.news contextualized how ETF inflows across BTC, ETH and alt tokens rebounded after year‑end tax selling and other seasonal effects — meaning inflows today can be both an idiosyncratic story for XRP and part of a larger institutional flow environment that allocates across multiple token ETFs.
How whale accumulation + ETF demand creates a breakout setup
Combine concentrated whale accumulation (e.g., large Upbit withdrawal), rising on‑chain volume, and persistent ETF buying and you get the conditions for a breakout: constrained supply meets consistent demand. This is not just a short squeeze; it’s structural tightening that can sustain higher price levels if inflows continue or if supply remains offline.
Two practical consequences for price action:
- Liquidity corridors thin near prior resistance, making it easier for a high‑volume push to clear order books and create a new price discovery regime.
- If issuers continue to pull inventory off the open market, sellers have less incentive to place limit sells near resistance — they may wait for higher bids, which accelerates momentum on breakouts.
However, issuance and creation mechanics mean supply can be reintroduced if issuers redeem shares or if large custodial holders decide to sell into strength. Monitoring both the ETF AUM/net flow updates and on‑chain reserve movements is therefore essential to distinguish a genuine structural breakout from a momentum‑driven pump.
Technical levels and a practical checklist for confirming a breakout
Technical work remains indispensable because on‑chain and ETF flows give context, not timing. Use the following checklist to evaluate whether XRP’s strength is a credible breakout or a failed rally.
Primary breakout criteria (look for multiple confirmations):
- Daily close above the prior multi‑week swing high on volume greater than the 30‑day average. Volume is the primary confirmation when supply dynamics are changing. Link that volume read to exchange outflows: if exchange balances fell before the breakout, weight the signal more heavily.
- Price above the 200‑day moving average and preferably above the 50‑day as well, with a convergence showing a shortening of trend risk.
- Momentum indicators: daily RSI moving above ~60 with bullish MACD crossover supports trend continuation; negative divergences warn of exhaustion.
- Institutional confirmation: public ETF filings/AUM updates showing continued inflows or authorized participant activity that suggests fresh buying rather than redemptions.
Failure or transition criteria (warnings the move could unravel):
- High volume distribution on the day of the new high followed by a daily close back below the breakout level — classic blow‑off top on speculative participation.
- Re‑entry of significant supply to exchanges (net deposits spike), or a reversal in whale behavior where previously withdrawn large wallets begin to transfer to exchanges.
- Price closes below the 50‑day MA within 3–5 trading sessions after the breakout — momentum fails to gather follow‑through.
A specific way to frame levels without relying on absolute prices: label the prior 6–12 week high as resistance R. A conservative breakout trigger is a daily close above R + confirmation (volume and moving averages). An aggressive entry might take intraday breakout retests of R as support with tight stop placement.
Trading rules and position sizing for XRP in 2026
Trading tokens that are ETF‑sensitive requires combining macro flow awareness with classic risk control. Here are practical rules tailored for intermediate traders.
Position sizing and risk per trade:
- Risk no more than 1–2% of total portfolio value on any single speculative XRP position. For larger institutional allocations, consider a 2–5% strategic allocation to ETF‑exposed tokens but keep active trade risk smaller.
- Use Average True Range (ATR) to set stops: ATR(14) on the daily timeframe gives a volatility‑aware stop. Example: if ATR = X, place stop at 1.5–2.0×ATR below your entry depending on your time horizon.
Entry frameworks:
- Aggressive: enter on intraday breakout with a stop below the breakout level. Keep position small and scale in on successful retests.
- Conservative: wait for a daily close above resistance with volume confirmation and place initial size. Add to position on pullbacks that hold above new support.
- Laddering: split size into 3 tranches—entry at breakout, add on first successful retest, final add on confirmation (e.g., weekly close above resistance).
Exit rules and profit targets:
- Scale out systematically: reduce exposure at pre‑defined reward:risk levels (e.g., sell 25% at 1:1, 25% at 2:1, 50% trailing with a volatility stop).
- Use trailing stops keyed to ATR or a moving average to capture extended moves while protecting against reversals.
- If ETF inflows reverse or exchange balances spike, tighten stops or exit; the structural premise has weakened.
Portfolio construction and correlation management:
- Recognize ETF‑driven XRP will correlate more with broader ETF flows (BTC/ETH) in the short term. Hedge exposure if you have broader directional bets — e.g., small short in a correlated instrument or cash overlay.
- Keep total speculative allocation to these ETF‑sensitive tokens at a measured share (2–8% depending on risk appetite).
Monitoring checklist for real‑time decision making
Set up a daily monitoring routine that includes:
- Exchange reserve changes and large wallet transfers (watch for new withdrawals or sudden deposits).
- ETF AUM/net flow reports and authorized participant notices — consistent net inflows equal continued structural support.
- Volume vs. price action (is every gap or surge accompanied by real volume?).
- Technical checks: moving averages, RSI, MACD and the integrity of retest levels.
Also track broader market liquidity cues and macro risk‑on/risk‑off dynamics; institutional flows into related ETFs can accelerate or blunt XRP moves. As a practical matter, platforms like Bitlet.app and institutional dashboards can help track order‑book liquidity and flow signals alongside your technical setup.
Risks and final considerations
- Redemption risk: ETF redemptions or a pause in inflows can quickly relieve buying pressure and return supply to the market.
- Concentration risk: a few whales controlling a large share of supply can amplify volatility; if those wallets decide to realize gains, the downside can be abrupt.
- Macro shocks: broader risk‑off events or regulatory headlines can override token‑specific flow dynamics.
The good news is that the current configuration — measurable whale accumulation, rising on‑chain volume, and ETF inflows that may be absorbing material supply — creates a higher‑probability backdrop for a meaningful breakout. That said, confirmable technical rules and strict risk management are essential; narratives move markets, but disciplined execution protects capital.
Conclusion
XRP’s January strength illustrates how concentrated on‑chain flows and institutional product demand can together flip the supply/demand balance, creating credible breakout potential. Traders should marry on‑chain evidence (withdrawals, reserve trends) with ETF flow reads and classic price/volume confirmation before committing capital. Use volatility‑aware stops, reasonable position sizing, and a clear scaling plan — and monitor ETF activity and large wallet behavior continuously.
Sources
- XRP price surges as volume soars and whale accumulation strengthens bullish outlook — TheNewsCrypto
- XRP bulls eye breakout as ETF inflows absorb 1% of supply — Crypto.News
- XRP turns into $1.37 billion ETF tug‑of‑war overnight — U.Today
- Why is Bitcoin price going up after US operation in Venezuela? — Crypto.News (context on ETF rebound flows)