Parsing Bitcoin Stress: ETF Outflows, Sub-$100k Slippage, and Institutional Signals
Summary
Executive summary
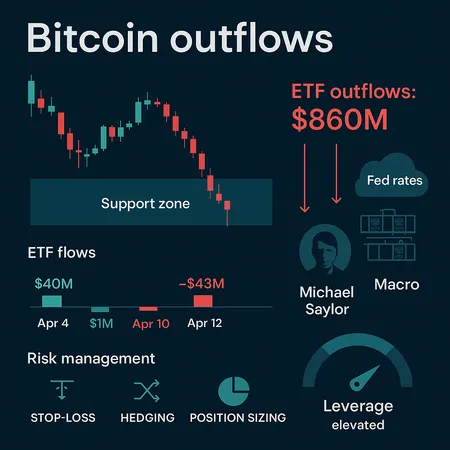
The market flash in recent sessions is less an isolated price blip and more a classic liquidity+sentiment event: large ETF outflows forced the liquidation and repricing of risk, clustered bid and ask liquidity reshaped order books, and public institutional messaging diverged from observed fund flows. The headline driver was a massive outflow from Bitcoin ETFs (the largest single outflow reported at just over $860 million), which coincided with BTC price probing below $100k and then into the $93–97k support band. This note parses the timeline, teases apart drivers (flows vs. fundamentals), and offers tactical risk-management and allocation ideas for the near term.
Timeline: ETF outflows and immediate market reaction
Begin with the most concrete datapoint: reports showed a sudden ETF withdrawal of more than $860M that amplified selling pressure and forced rebalancing across venues (Bitcoinist report). That outflow wasn't a vacuum; it arrived into an order book already reconfigured by clustered bids and liquidity pockets. Traders observed large bid walls and a cluster of roughly 2,800 BTC interest on Binance as the market slipped, which softened immediate downside but also highlighted where short-term liquidity resided (NewsBTC coverage).
Within hours of the ETF outflow headlines, BTC printed intraday moves that took it below $100k and, according to other coverage, under $95k in the face of macro rate anxieties and rotation to AI-related equities (PYMNTS). Simultaneously, some large institutional actors publicly denied selling—Strategy and Michael Saylor explicitly stated they were not dumping BTC and in fact were buying into weakness (Bitcoin.com report). The juxtaposition—ETF net outflows vs. public buying statements—creates an important tension for positioning.
Market structure: support zones, liquidity clusters and leverage
Technically, focus on the $93–97k zone as the primary short-term support band. That range is significant for three reasons:
- It’s where miners and long-term holders often resume selling or reduce exposure after sustained rallies. Miners' break‑even and tax/liquidity behavior anchor selling pressure in this neighborhood.
- Order book and exchange cluster data showed concentrated bids roughly around that band during the drop, suggesting short-term demand could absorb incremental selling up to a point. See the Binance clustered bid-wall observation for color on how book structure cushioned immediate downside (NewsBTC).
- If ETF redemptions continue or accelerate, the band becomes a natural liquidity sink where alpha providers and HFTs can execute without catastrophic slippage—until they can’t.
Leverage matters. The faster the outflow and the sharper the price movement, the more liquidations occur in leveraged futures markets—this amplifies downside beyond the initial fundamental flow. Intermediate traders should treat leverage as a force-multiplier: it increases both risk and the speed at which support zones are tested or violated.
Institutional messaging vs. observed flows: why they can disagree
Public statements like Michael Saylor’s denial of selling and declarations of buying add important narrative ballast, but they are not direct measures of ETF flows or overall institutional positioning. Three forces create the divergence:
- ETFs operate as separate conduits with their own investor base and redemption mechanics. ETF flows can be negative while other institutions accumulate OTC or on balance sheets. The $860M ETF outflow is a direct liquidity metric that must be respected (Bitcoinist).
- Institutions often manage headlines. A public denial of selling does not prove zero selling happened elsewhere or that other funds didn’t rebalance. Strategy’s statement that they were buying is a directional data point; it doesn’t negate large retail or institutional redemptions moving through ETFs (Bitcoin.com).
- Liquidity timing: selling into an ETF redemption window can be concentrated and rapid; buybacks from long-term institutional actors are often staged and executed over days or weeks, not instantaneously.
For CIOs this means reconciling headline soundbites with flow data. Treat ETF flows as high-resolution liquidity telemetry and public statements as lower-resolution conviction signals.
Macro and mining interplay with fund flows
Macro headlines—concerns around interest rates and an AI-driven rotation—were correlated with the same session where BTC dropped under $95k (PYMNTS). Higher real rates and equity risk-off push capital away from risk assets; when combined with a large ETF outflow, that can steepen drawdowns.
Mining economics also matter. Miners are liquidity providers when prices rally and sellers when pressured—especially if hashprice, margin finance needs, or tax/liquidation schedules trigger balance-sheet sales. The mining patchwork can therefore increase supply into a thin market already stressed by ETF redemptions.
Flows × macro × mining = non-linear impact. A modest ETF outflow during a calm macro day might be absorbed; the same outflow during rate‑fear headlines and miner selling can push BTC through support zones with speed.
Tactical ideas: risk management and portfolio allocation
Below are practical steps tailored to intermediate traders and CIOs. These are not investment advice but a framework you can adapt.
Position sizing & leverage
- Reduce gross leverage immediately after confirmed large outflows. If you’re running >2x leverage, cut exposure incrementally (e.g., 25–50%) and reassess liquidity over 24–72 hours.
- Use laddered exits/entries: scale out in tranches through the $97k, $95k, $93k levels rather than one full block.
Hedging and option plays
- Buy short-duration put spreads to cap downside inside the $92–98k region—cheaper than outright puts and effective for tactical protection.
- Sell call spreads for premium if you are structurally long and willing to cap upside; this lowers carry and offsets some of the cost of hedges.
Cash/Stablecoin allocation and rebalancing
- Keep dry powder: raise cash or stablecoin to 10–20% of risk portfolio if your mandate allows. That provides buying power if BTC revisits lower support or a capitulation event arises.
- Rebalance systematically: use dollar-cost averaging into the $93–97k band rather than attempting to pick a precise bottom.
Order execution & venue management
- Avoid large market orders during ETF redemption windows; use limit orders aligned with observed bid walls. The Binance clustered bids are a reminder that book liquidity matters (NewsBTC).
- Cross-venue routing helps reduce slippage—work with execution desks or use algos if managing >$5M blocks.
Governance & scenario rules for CIOs
- Predefine triggers: e.g., if ETF net flows remain negative for two consecutive trading days and BTC closes below $93k, increase hedges by X% or reduce gross exposure by Y%.
- Maintain event-response checklists: who executes hedges, who communicates to stakeholders, and how rebalancing occurs. Bitlet.app and other custody/execution tools can be part of your ops stack for streamlined settlements.
Scenarios and likely near-term outcomes
Scenario A — Controlled digestion (40% probability)
- ETF outflows moderate, macro fears calm. BTC stabilizes in $93–97k and grinds higher as buyers absorb selling. Institutional buyers like Strategy average up over weeks, supporting a recovery toward $105–115k.
Scenario B — Prolonged deleveraging (35% probability)
- Continued ETF redemptions plus additional macro headlines force more liquidations. Support at $93k fails, price tests the $85–90k band before stabilized bids reappear. Tactical buying below $90k becomes attractive for longer-term buyers.
Scenario C — Event cascade (25% probability)
- Large follow-on outflows coincide with miner distress or a macro shock. Rapid deleveraging and exchange stress drive flash liquidation; recoveries are slower and require clear flow reversal signals.
Adjust allocations based on which scenario plays out. If you’re actively managing a risk budget, the right move often is to trade volatility—not direction—through hedges and tighter execution.
Practical checklist for the next 72 hours
- Monitor ETF flows closely; treat large net outflows as a persistently bearish liquidity signal. See the $860M event as a calibration point.
- Reduce headline risk: lower leverage and trim exposure in 25% tranches.
- Put tactical hedges in place (short-duration put spreads) and stagger them across expiries.
- Keep 10–20% dry powder to scale into the $93–97k band, using limit orders near observed bid clusters.
- Reassess after 48–72 hours when flows, miner reports and macro prints give clearer direction.
Conclusion
This bout of Bitcoin stress is a textbook example of flow-driven volatility layered on macro and miner dynamics. ETF flows—particularly the reported $860M outflow—are high-fidelity liquidity signals and should be treated as such, even when institutional leaders deny selling and publicly buy into weakness. For intermediate traders and CIOs, the priority is straightforward: respect leverage, hedge tactically, use laddered sizing, and keep dry powder to exploit better risk/reward entry points in the $93–97k support band. Monitor flow data and execution quality closely; in this market, how you trade liquidity matters as much as what you believe about the long-term thesis.
For actionable execution and custody options as you implement these ideas, consider integrating flow analytics with your operational stack—platforms like Bitlet.app can be part of that mix to streamline settlements and trade ladders.