Zcash (ZEC) Breakout Play: Volume Surge, Key Resistance at $330 and the $400 Target
Summary
Executive snapshot
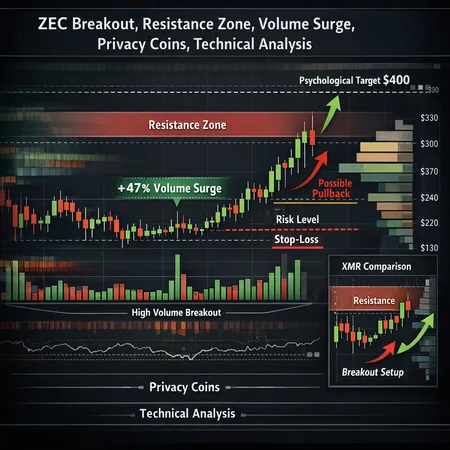
Zcash (ZEC) rallied over 20% in a short window while traded volume jumped roughly 47% versus the prior period, producing a textbook breakout above a multi-week descending range and visible resistance cluster. The immediate area of interest is a resistance zone centered near $300–$330; beyond that lies a psychological stretch at $400 that becomes a technical and narrative target if momentum holds. Below we unpack the structure, offer a clear trade plan keyed to on‑chain and order‑book signals, and place ZEC’s move in context with other privacy coins like XMR.
What happened: breakout anatomy and volume profile
Price action: ZEC cleared a descending trendline and a short-term horizontal cap with a wide bullish candle. That breakout candle printed on elevated participation — volume spiked roughly +47% relative to the prior average, reinforcing conviction that buyers led the move rather than a thin liquidity sweep (source: Coinpedia ZEC price analysis).
Volume profile and context: look for a high-volume node around the breakout area; the market accepted the breakout price on meaningful flow, which is healthier than a narrow-volume wick. A proper volume‑profile chart will show a value area shift upward with a new developing high‑volume node between the former resistance and $330.
Market implications: when a breakout accompanies a significant volume pickup, the probabilistic edge favors continuation — but only while sellers don’t reassert themselves at major supply levels. Traders should treat the $300–$330 band as the first real proving ground.
Key technical levels (watchlist)
- Immediate support (post‑breakout): breakout close / high of the breakout candle (use this intra‑day for tight risk). If that’s unclear, mark the 20–50% pullback zone of the breakout leg as support.
- Structural support: the prior consolidation lows and volume nodes near $220–$260 (expect retest attempts into this zone if buyers fatigue).
- Primary resistance zone: $300–$330 (overlap of prior highs and current supply cluster).
- Target (if momentum continues): $400 psychological/resistance level.
These are working levels; adapt them to the timeframe you trade (spot, margin, or futures) and overlay a 20–50 day EMA to gauge trend bias.
Probable short‑term scenarios and probabilities
Scenario A — Bull continuation (40–50% probability)
- Conditions: breakout holds, volume on pullbacks remains subdued, and new buying appears on retests or order‑book gaps. A successful reclaim of and hold above $330 with increasing buy-side depth indicates path to $400.
Scenario B — Range/resolution (30–40% probability)
- Conditions: breakout fails to attract follow‑through, price oscillates between $220–$330 while liquidity refreshes. Market consolidates, forming a higher low or a lower high depending on macro bias.
Scenario C — False breakout and deeper retest (20–30% probability)
- Conditions: sellers overwhelm at the $300–$330 zone or large exchange inflows produce sell pressure; price revisits $180–$240 structural supports. Watch for fast volume spikes with no lasting bid — classic stop‑run behavior.
These probabilities are conditional; update them with real‑time on‑chain flows and order‑book reads.
Trade plan: entries, sizing and stops
Trade frameworks depend on time horizon. Below are three practical setups for active altcoin traders.
- Momentum entry (short‑term swing)
- Trigger: break and close above $330 on daily or 4H with volume ≥ prior breakout volume.
- Entry: on close above trigger or a small pullback (5–10%) to the breakout zone with persistent buy‑pressure.
- Stop: below the breakout candle low or below 1.0–1.5 × 20‑day ATR, whichever is wider.
- Target: partial at $330 (if entered earlier), final at $400.
- Risk management: risk 1–2% of account on the trade; trail stop to breakeven after 1R and lock profits on subsequent key levels.
- Breakout retest / structure trade (higher probability, lower reward)
- Trigger: clean retest of breakout level (near the new support) with decreasing sell volume and renewed buying on bid‑side pressure.
- Entry: buy the retest when price forms a bullish rejection candle and order‑book shows absorbent asks.
- Stop: below retest low or below a nearby low volume node; keep a tighter ATR multiple (0.8–1.2 × ATR).
- Target: $330 then $400.
- Mean reversion / risk defined fade (for nimble traders)
- Trigger: failure at $300–$330 with a clear rejection candle and sell‑side order‑book walls; confirmation via large exchange inflows.
- Entry: short the rejection if risk controls and position limits allow.
- Stop: above the rejection high plus a small buffer (e.g., 0.5–1.0%).
- Target: $220–$260 structural support band.
Sizing rules
- Calculate position size by: risk per trade (%) / distance to stop (%). Keep aggregated correlated risk across privacy coins (XMR, DASH exposure) low.
- If trading futures/leverage, reduce nominal exposure to account for liquidation risk.
Stop strategies and adjustment mechanics
Preferred stop styles
- Structure stop: place stop just beyond a clearly violated structural level (breakout candle low or a major prior swing).
- ATR stop: use 1.0–1.5 × ATR for swing trades to account for expected volatility.
- Time‑based stop: if price fails to progress to first target within X days (e.g., 7–14 days), reduce size or exit — momentum trades that stagnate often underperform.
How to move stops
- After 1R: move stop to breakeven minus small buffer to remove tail risk.
- After significant confirmation (e.g., reclaim of $330 with increasing depth): trail stop along a shorter EMA (e.g., 20 EMA on 4H) or use higher timeframe swing lows.
- If on‑chain data shows sudden exchange inflows or whale transfer to exchanges, tighten stops immediately.
On‑chain and order‑book signals to watch (execution cues)
On‑chain cues
- Exchange inflows/outflows: rising inflows can presage sell pressure; sustained outflows suggest hodling and lower immediate sell risk.
- Large address movement: whales distributing to exchanges near resistance is a red flag.
- MVRV and realized profit metrics: if unrealized profits spike, odds of supply entering are higher.
Order‑book cues
- Buy/sell wall dynamics: a persistent sell wall near $330 that doesn’t evaporate under buying pressure signals strong supply.
- Order‑book imbalance and depth: skewed bid/ask depth with widening spreads on fills suggests fragile liquidity — avoid entering heavy size.
- Time & Sales: steady large buyer prints on lifting asks supports continuation; aggressive large sells (market sells) near resistance favor rejection.
Combined triggers
- Favor entries when on‑chain and order‑book signals agree: e.g., outflows from exchanges + buy‑side depth growth + rising whale accumulation = higher confidence for continuation. Conversely, inflows + large passive sell orders = higher odds of fade/false breakout.
How ZEC fits into the privacy‑coin rotation (comparison to XMR)
Recent price action across privacy coins shows correlated bursts of momentum and rotation between names. ZEC’s breakout resembles earlier patterns seen in XMR: a consolidation followed by a volume‑backed breakout forming a higher high. Coinpedia’s Monero coverage highlights how XMR recently tested a key zone with a clean breakout setup; ZEC’s action is analogous in structure but slightly lagged in time and liquidity profile (source: Coinpedia XMR outlook).
Comparative notes
- Volatility and liquidity: XMR historically carries higher liquidity relative to ZEC; ZEC's breakout on a +47% volume jump is meaningful precisely because its average liquidity is lower — fewer contracts or tokens can move price more easily.
- Correlation: when XMR leads a bullish phase among privacy coins, capital often rotates to smaller, structurally similar names (ZEC, DASH). Coinpedia’s Dash analysis also documents momentum cues and volume signals that echo across the group, reinforcing the rotation thesis.
- Trade implication: if XMR confirms sustained strength and on‑chain metrics show reduced exchange sell pressure, ZEC has a higher chance to run toward targets like $400. If XMR falters, expect greater headwinds for ZEC.
Practical checklist before taking risk
- Confirm breakout with follow‑through volume or a clean retest into the breakout zone with order‑book absorption.
- Check exchange inflows/outflows for ZEC addresses and major wallets; avoid initiating size if large inbound flows spike.
- Ensure leverage/sizing respects account risk; cap correlated exposure to privacy coins.
- Watch macro liquidity and Bitcoin direction — for many traders, Bitcoin remains the primary market bellwether and can flip risk‑on/off quickly.
Execution notes and tactical considerations
- Use limit entries layered across your target zone to avoid single‑fill slippage; cancel layers if order‑book pressure shifts.
- For retail platforms, prefer exchanges showing honest depth and low spread; tools that combine order books and on‑chain flow (available natively or via platforms such as Bitlet.app integrations) shorten reaction time.
- Keep a trading journal: record entry trigger, visible on‑chain/order‑book cues at entry, and why you adjusted stops.
Risk disclosure and closing thoughts
ZEC’s breakout is technically meaningful because it printed on a notable volume surge and moved price into the $300–$330 battleground. A measured, signal‑driven approach — using a mix of structural stops, ATR buffers, and on‑chain/order‑book confirmation — gives the best risk‑adjusted path to exploit the move. Privacy‑coin rotation can amplify returns but also concentrates correlated drawdown risk; manage sizing accordingly.
Sources
- Coinpedia — Zcash price analysis documenting ZEC’s >20% surge, volume increase and resistance levels: https://coinpedia.org/price-analysis/zcash-zec-price-analysis-400-in-sight-or-resistance-ahead/
- Coinpedia — Monero price outlook and comparable breakout setup: https://coinpedia.org/price-analysis/monero-price-outlook-xmr-tests-key-zone-as-breakout-setup-strengthens/
- Coinpedia — Dash momentum context and volume/momentum signals across privacy coins: https://coinpedia.org/price-analysis/dash-gears-up-for-bullish-wave-3-can-the-price-break-the-broder-downtrend/