Has Bitcoin Found a Durable Bottom After the $70k Slide? An Evidence-Based Playbook
Summary
Quick framing: why this matters now
Bitcoin’s tumble below $70,000 coincided with a pronounced spike in bearish chatter — a signal many traders watch closely. That surge in negative sentiment, flagged by third‑party trackers, matters because market psychology can accelerate momentum both down and up. For many traders, Bitcoin remains the primary bellwether for crypto risk-on flows, so separating noise from durable structural change is critical.
In short: sentiment is ugly, whales are active, and institutions are still deciding whether to scale or hold. This piece unpacks those inputs, cites recent technical and on‑chain work, and ends with a pragmatic playbook for intermediate traders and investors.
What the data is saying
Santiment: bearish chatter spiked — why that’s important
Santiment’s negative-sentiment indicators hit elevated readings recently, and market commentators flagged the timing as one of the densest bouts of bearish talk in 2026 so far. Reports noting the Santiment spike show a clear correlation between retail vocal negativity and short-term price pressure (Santiment signal spike coverage).
Bearish sentiment can be a contrarian buy signal when extreme, but it’s not a trading rule on its own. Context — who’s talking, where funds are flowing, and whether large holders are accumulating or selling — matters more.
Whale walls and log‑regression fair-value: boxed-in risk
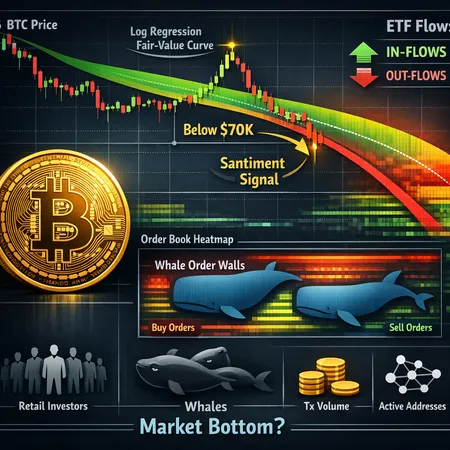
On the technical side, several analyses note large limit orders and concentrated supply regions — often called whale walls — that can cap rallies and create a banded market. A log-regression fair-value model used in recent write-ups suggests BTC could remain trapped in a wide but persistent range unless broken by fresh liquidity or a structural event (whale walls and fair-value analysis).
Practically, that implies short squeezes are possible but sustainable trend changes require either (a) the absorption of those walls by buyers, or (b) a shift in the supply-side incentives for those large holders.
On‑chain indicators to watch
Key on-chain metrics that help judge whether a bottom is forming:
- Exchange balances: falling exchange supply can indicate distribution drying up; rising balances often precede selling.
- Whale accumulation vs distribution: large address inflows/outflows (and clustered limit orders) signal whether "smart money" is buying the dip.
- Realized price bands and MVRV: shrinking negative MVRV across cohorts suggests capitulation easing.
- Futures funding and open interest: persistent negative funding (shorts paying longs) or rising OI ahead of breakdowns can amplify moves.
Watching these together — not in isolation — helps filter transient fear from structural weakness.
Competing analyst views: bottom or more pain?
Analyst opinions are split. Some argue the worst is priced in and that current dips represent a buying opportunity; others warn of deeper downside as leverage unwinds and whale resistance holds. A recent roundup shows this split clearly, with experts weighing macro risk, derivatives positioning and on-chain supply dynamics to reach divergent conclusions (experts split on bottom vs downside).
Why the split persists:
- Bull case: ETF adoption, lower on‑chain selling, and institutionally driven demand reduce available supply and create a structural bid.
- Bear case: concentrated holder sell pressure, weak macro liquidity, and technical walls keep BTC boxed, enabling further downside into lower support bands.
That ambiguity is normal; markets rarely give clean certainties. Instead, prepare scenarios and size bets accordingly.
ETFs, macro flows and the ‘gold vs Bitcoin’ narrative
Institutional demand via ETFs is the wild card. Recent coverage suggests ETF inflows could eventually rival capital flows away from traditional stores like gold, changing liquidity dynamics in BTC’s favor (ETF flows gaining vs gold). If steady institutional inflows resume or accelerate, whales will find it harder to hold BTC captive under persistent sell pressure.
But there are timing caveats:
- ETF demand is not instantaneous. Licensing, allocation algorithms and custody flows take time to show up as persistent on‑chain buying.
- Short-term liquidity can still snap back and create squeezes without changing the long-term supply curve.
So, ETF flows are a powerful medium-term tailwind if sustained, but they don’t negate the near-term technical and on‑chain friction that could keep BTC range-bound.
Putting it together: is a durable bottom in place?
Short answer: not conclusively. The balance of evidence is mixed.
- Negative sentiment reached extremes, which historically can mark local lows — but extremes alone aren’t sufficient.
- Whale walls and log-regression fair-value models argue the price could stay boxed unless those walls are absorbed.
- ETF and institutional flows are a convincing bullish structural narrative, but benefits compound over months, not minutes.
In practice, that means we should prepare for both scenarios: a retracement into deeper support, or a churn phase that grinds sideways until a large liquidity event (ETF inflows, macro relief, regulatory clarity) breaks the range.
A practical playbook for intermediate traders and investors
Below are concrete, actionable steps calibrated by timeframe and risk tolerance.
Risk management (non‑negotiable)
- Position sizing: risk no more than 1–3% of portfolio value on any single directional trade; dollar-cost average (DCA) for longer-term allocations.
- Stop rules: define absolute and emotional stops. For swing trades use price-based stops; for multi-month investors use allocation caps and rebalancing rules.
- Margin use: avoid excessive leverage while whales are active; funding spikes and liquidations can trigger abrupt moves.
Entry zones and timeframes (guidance, not guarantees)
- Conservative investor (multi-month horizon): DCA into a range. If BTC retests lower historically relevant bands (e.g., mid-to-low $60k range based on current models), increase contributions incrementally.
- Tactical swing trader (weeks): favor entries at on-chain-confirmed support where exchange outflows and whale net accumulation are visible. Use tight, data-backed stops and scale in.
- Aggressive trader (days): watch funding rates and OI; trade squeezes but size positions small and use strict risk controls.
Suggested zone framework (example ranges — adapt to real-time price and models):
- Key support band: low‑to‑mid $60k area (where buyers historically accumulate).
- Near-term resistance: $72–78k band where whale walls often show.
- Breakout to price discovery: sustained close above prior structural supply zone with falling exchange balances and positive ETF headlines.
Trade checklist before adding fresh capital
- Confirm exchange balances are not spiking higher.
- Look for net whale accumulation (on-chain flows into cold wallets or decreased limit-sell clustering).
- Funding rate neutral or slightly positive (suggests shorts unwound or buying pressure).
- Corroborating macro signal (e.g., equities stability, easing rates narrative) or confirmed ETF buy headlines.
Tools and metrics to monitor
- Exchange reserve charts (Glassnode-type metrics).
- Whale transfer alerts and concentrated orderbook levels.
- MVRV and realized price distribution bands.
- ETF flow reports and custody inflow snapshots.
Tactical scenarios and sample trades
- Scenario A — Range-bound: prefer limit buys at lower support with small size, aim for mean-reversion sells near whale walls; avoid holding through full range expansion events.
- Scenario B — ETF-led breakout: scale in on pullbacks after confirmed absorption of supply and sustained inflows; rotate into longer-duration holdings.
- Scenario C — Breakdown: reduce size, hedge with options or inverse products, and accumulate only on confirmed capitulation signals (e.g., high exchange deposits and washout indicators).
Final thoughts
Sentiment is a useful alarm bell, but it’s one input among many. The Santiment spike and below‑$70k slide increased the odds of near-term volatility; whale walls and fair‑value models remind us that structural resistance exists; ETF flows offer a potent but gradual demand source that could validate a longer‑term bottom. For traders and investors the prudent path is scenario planning, disciplined sizing, and using on‑chain cues to confirm — not merely hope for — a bottom.
Bitlet.app users should consider these signals alongside platform-specific tools (order types, DCA plans and custody options) when implementing a plan.
Sources
- "Bitcoin bearish chatter hits 2026 peak as price drops below $70k" — Crypto.News: https://crypto.news/bitcoin-bearish-chatter-hits-2026-peak-as-price-drops-below-70k-more-pain-ahead/
- "Bitcoin BTC price analysis: Experts split on whether bottom is in or more pain ahead" — Blockonomi: https://blockonomi.com/bitcoin-btc-price-analysis-experts-split-on-whether-bottom-is-in-or-more-pain-ahead/
- "Bitcoin price prediction: Whale walls keep BTC boxed in" — Coinpaper: https://coinpaper.com/15989/bitcoin-price-prediction-whale-walls-keep-btc-boxed-in?utm_source=snapi
- "Bitcoin ETFs gaining ground; could soon surpass gold — analyst" — NewsBTC: https://www.newsbtc.com/news/bitcoin/bitcoin-etfs-gaining-ground-could-soon-surpass-gold-analyst/