How Spot Bitcoin ETFs (IBIT) Are Driving Short-Term Volatility in the Current Bear Phase
Summary
Why spot Bitcoin ETFs matter right now
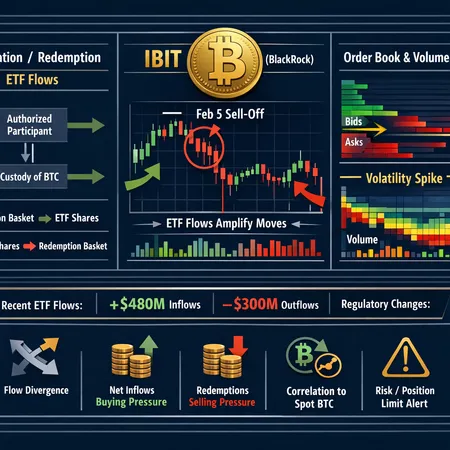
Spot Bitcoin ETFs are no longer a niche plumbing detail — they are a primary channel by which large pools of institutional and retail cash enter or exit BTC. For many traders, the presence of ETFs changes how and when buying pressure hits the spot market: instead of millions of retail retail trades trickling in, exchanges and authorized participants (APs) convert ETF creations and redemptions into concentrated blocks of BTC that must be sourced or deposited quickly. That concentration elevates short-term volatility and reshapes the microstructure of the crypto market. For context on product leadership and flows, many market participants now watch IBIT (BlackRock’s ETF) and peer listings closely. Bitlet.app users, for example, increasingly monitor ETF-related signals alongside traditional indicators.
ETF creation/redemption mechanics — the engine of short-term flows
At the core: spot ETFs accept cash from investors and create shares by acquiring the underlying asset (BTC), or they redeem shares by returning BTC to the market and handing out cash. Authorized Participants (APs) and market makers are the intermediaries who perform these conversions, and they balance ETF inventory via OTC spot buys/sells, exchange transactions, or borrowing. When ETF demand is steady, APs steadily source BTC; when demand flips, large redemptions can force rapid selling into an already thin order book.
How creations amplify buys and redemptions amplify sells
When an ETF needs BTC for creations, APs place concentrated bids, which can lift spot prices quickly — especially in low-liquidity windows. Conversely, redemptions translate into blocks of BTC hitting the market, often executed algorithmically and sometimes clustered in time. That clustering is why ETF flows can create short, sharp moves: the market isn't absorbing millions of small orders, it's digesting fewer, much larger blocks. Traders should treat ETF flows as a liquidity multiplier rather than just another demand curve.
How ETF flows amplified the Feb. 5 sell-off
The Feb. 5 event has been dissected by many analysts who argue ETF mechanics — not a sudden change in crypto fundamentals — played an outsized role. A detailed post-mortem pointed to how redemption mechanics and hedging flows rippled through the market on that day, turning localized selling into a broader drawdown. See an analysis that attributes the plunge to ETF mechanics rather than pure crypto panic for a granular read on sequencing and AP behavior.
At the same time, ETF cash flow reports show that inflows and outflows around that date were nontrivial and concentrated in flagship products. Some outlets reported sustained inflows into U.S. Bitcoin ETFs led by BlackRock’s IBIT even as price moved (for example, a headline citing $330M in inflows into U.S. ETFs led by IBIT). Yet attribution is contested: other deep-dives question whether IBIT itself directly ‘crashed’ Bitcoin or whether AP execution and hedging dynamics were the proximate cause. The nuanced truth is usually in the mechanics — how APs execute and how hedgers (including high-frequency market makers) manage inventory — which can amplify normal drawdowns into flash-like events.
IBIT, position limits, and exchange-level adjustments
IBIT quickly became one of the largest flow recipients after launch, forcing clearinghouses and exchanges to examine how these new flows interact with existing market infrastructure. Discussions and eventual decisions around position limits and Nasdaq’s adjustments to level the playing field show regulators and exchanges are aware that ETF concentration creates new systemic vectors. Analysts have noted that specific adjustments tied to IBIT position limits and Nasdaq-level actions were intended to reduce single-product concentration risk, but they also change how APs and market makers hedge, which in turn affects intraday liquidity provisioning.
Data snapshot: inflows, outflows, and what the numbers tell us
Concrete flow numbers are a practical starting point. For instance, reports of roughly $330M in inflows across U.S. Bitcoin ETFs — with IBIT leading — are a signal that persistent demand exists even amid price weakness. But raw inflows are incomplete: traders should watch net daily creation/redemption tallies, the timing of those events, and whether APs are sourcing spot BTC on exchanges or via OTC desks. Media reports and flow trackers can show headline sums, but the execution footprint (where and when BTC was bought or sold) determines price impact. Macro headlines and ETF outflows combined can be a double trigger: if macro data weakens risk appetite at the same time ETFs see redemptions, the combined pressure is materially larger than either factor alone.
Practical trading framework — how to read ETF flow signals (actionable)
Below is a concise toolkit for intermediate traders and portfolio managers to interpret ETF-driven moves:
- Monitor daily creation/redemption tallies: a persistent net-creation trend supports spot; sudden net-redemptions can presage rapid selling. Combine these tallies with on-chain spot flows when possible.
- Watch NAV premium/discount to ETF market price: expanding discounts during redemptions indicate sellers are constrained and APs are executing into a thin book.
- Track IBIT-specific filings and leading-list flows: large IBIT inflows/outflows matter more than smaller niche ETFs due to concentration.
- Follow authorized participant hedging signals: rapid increases in futures basis or options skew often precede aggressive ETF-related execution as hedgers lay off risk in derivatives.
- Use orderbook depth and large-block prints: if ETF creation requires spot buying, you'll often see large bids sweep across levels; redemptions may produce large sell prints and widening spreads.
- Combine ETF flow reads with macro context: Fed prints, CPI surprises, or risk-off equity moves can tip a balanced ETF flow into a crash-style event, as some reports linked ETF outflows and macro data to recent BTC weakness.
- Size and stop discipline: because ETF-driven moves are concentrated, use staggered position sizing and wider stops intraday, or hedge delta with futures rather than relying purely on spot exits.
These steps help translate headline flow numbers into a trading signal set that accounts for timing, execution, and market structure.
Risk scenarios and a practical checklist for portfolio managers
Prepare for three primary scenarios: (1) persistent inflows that compress volatility but raise concentration risk, (2) episodic redemptions that cause short, sharp drawdowns, and (3) combination shocks where ETF outflows coincide with macro risk events. A checklist to manage those risks:
- Maintain access to OTC liquidity and APs for large executions.
- Stress-test portfolios for concentrated ETF-driven liquidity shocks (simulate redemptions of X% over Y hours).
- Use futures basis and options skew as early-warning indicators for forced liquidation risk.
- Communicate execution strategy with custodians and prime brokers in periods of elevated ETF flows.
Conclusion
Spot ETFs have transformed Bitcoin’s liquidity profile: they channel large pools of capital through creation/redemption mechanics that can concentrate buying and selling into tight windows, amplifying short-term volatility. IBIT and its peers matter not only for long-term demand but for the microstructure they create — and that microstructure is now a primary driver of bear-phase price action when flows reverse. Traders and portfolio managers who incorporate creation/redemption tallies, NAV spreads, derivatives hedging flows, and orderbook footprints into their playbook will be better positioned to navigate ETF-driven moves.
Sources
- Why Bitcoin Fell on Feb. 5 — Analysis blames ETF mechanics
- U.S. Bitcoin ETFs see $330M inflows led by BlackRock's IBIT
- Did BlackRock's IBIT really crash Bitcoin? Deep look at attribution
- iBit position limits and Nasdaq adjustments to level the playing field
- BTC under $70k as ETF outflows and US data rattle markets — macro linkage


