Altcoin Resilience During a BTC Drawdown: MYX, XMR and SHIB Case Studies
Summary
Why altcoin resilience matters when BTC falls
When BTC leads a market-wide drawdown, most altcoins usually follow. Yet, a recurring pattern in recent months has been select tokens that decouple — they show relative strength or even rally despite a BTC-led sell-off. That resilience matters because it can: a) indicate genuine capital rotation into specific narratives, b) reflect idiosyncratic flows (whale accumulation, token unlocks, listings), or c) be a short-lived gamma squeeze. Spotting which is which is a core skill for portfolio managers and active traders.
For many market-watchers, Bitcoin remains the headline risk, but the micro-structure of individual tokens often tells a different story. Below I document three case studies — MYX Finance (MYX), Monero (XMR), and Shiba Inu (SHIB) — and provide a repeatable framework to evaluate whether an altcoin’s strength signals market rotation or something more narrow.
Quick market context: what a BTC drawdown typically does
During a BTC drawdown you usually see: elevated exchange inflows, widening bid-ask spreads in small markets, and rising correlations across the altcoin complex. However, liquidity fragmentation means some tokens can absorb buying pressure without moving in lockstep with BTC. Understanding whether an outlier is structurally strong or just technically squeezed requires combining price action with on-chain and off-chain signals.
Case studies: MYX Finance, XMR, and SHIB
MYX Finance (MYX): a narrative + listing-driven rally
MYX Finance grabbed headlines by outperforming BTC during a broader market pullback, rallying while many majors slid. Coverage noted the token’s surge despite general market weakness, suggesting concentrated demand and narrative strength around the protocol's product roadmap and new listings (BeInCrypto report).
What to check if you trade MYX:
- Price behavior: look for sustained higher-volume candles rather than a single spike; multiple higher-volume sessions indicate distribution among buyers, not a one-off squeeze.
- On-chain signals: watch exchange inflows/outflows, top-holder concentration, and contract interactions. For newly listing-driven moves, exchange flow often shows net inflows decreasing as buying pressure absorbs available supply.
- Narrative drivers: listing announcements, partnership news, or protocol upgrades can create asymmetric interest that decouples a small-cap token from BTC.
Why this can be idiosyncratic: small-cap tokens often move on a handful of large orders or listings. A MYX rally amid a BTC drop is plausible without broader rotation — but repeated, volume-backed strength across exchanges would raise the odds it's more than noise.
Monero (XMR): real-asset demand and privacy narratives
Monero has historically behaved differently from many altcoins because it serves a clear use case — privacy — and has a mature on-chain profile. Recent coverage flagged XMR and other altcoins as showing independent strength despite a bearish market (The News Crypto).
What to check if you trade XMR:
- Price action: stronger-than-expected support zones and lower correlation to BTC during the drawdown suggest demand from fundamentally motivated buyers rather than short-term leverage.
- On-chain metrics: active addresses, median output value, and mixin statistics (where available) can indicate real network usage. For privacy coins, exchange flows matter too — sustained withdrawals to non-custodial wallets point to accumulation.
- Narrative drivers: regulatory chatter, privacy-focused macro narratives, or on-chain adoption events can elevate demand independently of BTC's price action.
Why this can signal rotation: XMR is less of a speculative small-cap and more of a thematic play. If buyers rotate capital from BTC into privacy-led or utility-driven assets, XMR could be an early beneficiary — especially if on-chain demand rises alongside price.
Shiba Inu (SHIB): memecoin dynamics and technical setups
SHIB displayed an interesting pattern where technical setups and meme-driven demand appeared to mitigate the BTC sell-off. Technical analysis pieces suggested bullish patterns and potential short-covering bounces even after broader crashes (U.Today analysis).
What to check if you trade SHIB:
- Price and liquidity: memecoins often show explosive intraday moves; measure depth across top DEXs and CEXs to avoid entering into thin markets.
- On-chain dynamics: look for increased NFT or token utility chatter, whale accumulation, and burn events. For SHIB, burn mechanics and community-driven narratives are important volume drivers.
- Narrative drivers: social sentiment, high-profile endorsements, or coordinated buy campaigns can sustain rallies even during BTC weakness.
Why this is likely idiosyncratic: memecoin rallies often depend on retail psychology and momentum, which can reverse quickly. Unless accompanied by meaningful increases in liquidity and sustained exchange demand, memecoins should be treated as high-probability, short-duration trades rather than structural rotation signals.
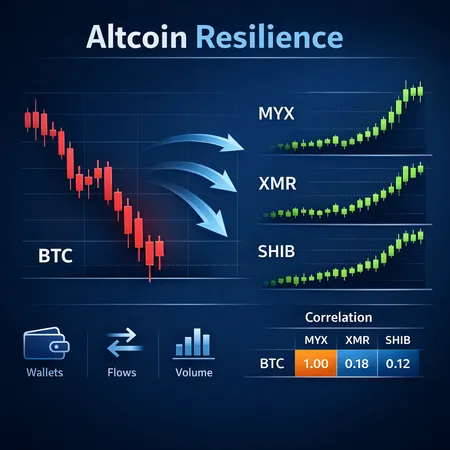
Correlation analysis: how to tell idiosyncrasy from rotation
A systematic correlation framework helps separate random outperformance from genuine rotation. Here’s a pragmatic approach traders can use in real time.
Step-by-step correlation framework
- Choose windows: compute rolling Pearson correlations (e.g., 7-, 30-, and 90-day windows) between BTC returns and each altcoin’s returns. Short windows capture immediate decoupling; longer windows show persistence.
- Volatility-normalize: use rolling volatility (annualized) to normalize returns — a token with 4x BTC volatility will have distorted raw correlations if unadjusted.
- Volume-weight validation: compare correlation shifts with volume spikes. A correlation drop paired with rising, cross-exchange volume suggests true decoupling.
- On-chain corroboration: confirm with exchange flows, active addresses, and top-holder concentration. Low exchange inflows plus rising active addresses supports genuine demand.
- Cross-section check: if multiple tokens within the same narrative (privacy, memecoins, DeFi) decouple, that increases the probability of rotation into that theme.
Interpreting results
- Transient decoupling: short-window correlation down but no volume/on-chain confirmation → likely idiosyncratic squeeze or short-covering.
- Sustained low correlation with on-chain demand: longer-window correlation down, rising non-exchange flows, and active usage → more consistent with market rotation into that narrative.
- High correlation despite price divergence: sometimes price anomalies revert quickly; high correlation signals mean the altcoin is still driven by BTC risk-on/off cycles.
Applying this to MYX/XMR/SHIB: market reports show each token outperformed BTC during a drawdown, but the likely explanation differs. MYX’s strength looks driven by listing/narrative flows, SHIB by memecoin momentum and possible technical setups, while XMR’s resilience aligns more with narrative-driven, utility-led accumulation. Use rolling correlation and the volume/on-chain checks above to validate those hypotheses in live trades.
Why certain narratives and tokenomics outperform in a crash
Some tokens have structural reasons to decouple:
- Utility and on-chain demand: protocols with measurable usage (active addresses, fees collected) can attract buyers seeking real yield or utility exposure.
- Fixed supply / burn mechanics: aggressive token burns or deflationary mechanics can create scarcity narratives that absorb sell pressure.
- Listing and liquidity events: new exchange listings, liquidity mining incentives, or airdrops can attract capital even when BTC is falling.
- Market segmentation: privacy coins or niche DeFi protocols sometimes appeal to buyers seeking alternative risk exposures.
Tokenomics matters. A well-distributed supply with steady organic demand resists rapid dumps better than a highly concentrated token that depends on a few whales. That’s why technical due diligence (token unlock schedules, vesting, top-holder concentration) is non-negotiable before sizing positions.
How to size altcoin exposure in a risk-off environment
Portfolio managers need a disciplined playbook for allocating to altcoins during BTC drawdowns. Below are practical rules tailored to active traders and PMs.
Sizing rules
- Base allocation cap: limit total altcoin exposure to a fixed fraction of risk budget during drawdowns (e.g., 5–15% of portfolio risk capital depending on mandate). Small-cap or memecoins should sit at the lower end.
- Volatility-adjusted sizing: scale position size inversely to the token’s realized volatility. If SHIB is 3x more volatile than BTC, allocate proportionally less.
- Liquidity filter: require minimum average daily traded value (across major CEX/DEX) before adding size. Illiquid tokens deserve a large liquidity haircut.
- Event sizing: for news/listing-driven moves (MYX case), use tranche entries: initial small starter + follow-up size if volume and on-chain metrics confirm the thesis.
- Correlation hedge: maintain a market hedge (short BTC futures or put protection) sized to the portfolio’s net directional exposure, not just the altcoin position.
Risk controls and trade management
- Tight risk-first stops: define stop-loss levels based on liquidity and structural support (not arbitrary percent). Use TWAP/limit exits to avoid slippage in thin markets.
- Event triggers for re-eval: re-assess after token unlocks, major listings, or regulatory developments. These events often flip idiosyncratic trades into risk events.
- Position monitoring cadence: review intraday for memecoins, daily for small-caps, and weekly for mature projects like XMR.
Practical example: if a PM allocates 10% of risk budget to altcoins during a drawdown, they might split it 50% into mid-cap thematic bets (XMR-like), 30% into opportunistic small-cap trades with strict stop rules (MYX-like), and 20% into very short-duration momentum plays (SHIB-like) with strict gamma management.
Bitlet.app users commonly apply similar-sizing frameworks across spot and installment products — always match product suitability to risk appetite.
Closing framework: trade the signal, not the story
Altcoin resilience during a BTC drawdown can be real — especially when corroborated by on-chain demand, cross-exchange volume, and narrative cohesion across similar tokens. But many apparent decouplings are short-lived and driven by thin liquidity or headline events.
For portfolio managers and active traders: combine rolling correlation analysis, volatility-adjusted sizing, and hard liquidity filters. Treat memecoins as tactical plays and utility-led tokens (like privacy coins or DeFi with real usage) as thematic allocations — still size them cautiously.
When in doubt, run the simple checklist: volume confirmation + exchange flow + sustained low correlation over a 30–90 day horizon = higher probability of true market rotation. Otherwise, assume idiosyncratic risk and size accordingly.
Sources
- Report on MYX Finance’s outperformance: MYX Finance price outshines Bitcoin
- Coverage on altcoins showing strength including XMR: Altcoins defy bear market as Night Hype and XMR show strength
- Technical analysis on SHIB bullish pattern: Shiba Inu: Key bullish pattern — is 30% bounce possible?


