Is a Market Crash the Right Time to Buy Bitcoin? A Practical Guide for Retail Investors
Summary
Introduction — why this question matters now
When markets swoon, the debate resurfaces: is a crash the best time to buy Bitcoin? For many retail investors the impulse is rational—buy low—but the modern Bitcoin market is not the same animal it was in 2013 or 2017. Institutional product flows, deeper derivatives markets, and new on-chain indicators change the risk/reward calculus.
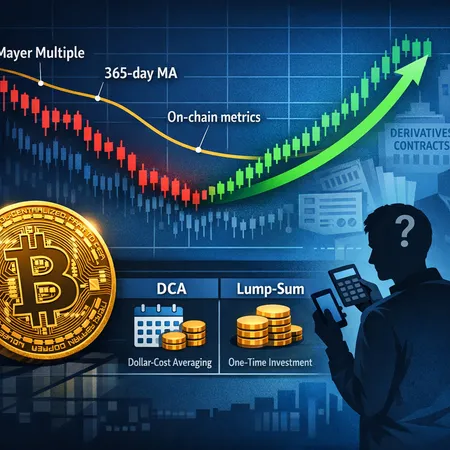
This article blends historical performance, practical frameworks for dollar-cost averaging vs. lump-sum buys, technical signals like the Mayer Multiple and the 365‑day moving average, plus on-chain metrics and retail risk-management steps. I reference retail guidance for crash behavior, a technical market-warning on liquidity heatmaps, and an on-chain research counterpoint that argues Bitcoin could be in structural decline to keep the analysis balanced.
For many traders, Bitcoin remains the primary market bellwether, but that doesn't mean the same trade fits every investor.
What history tells us: BTC after major drawdowns
Bitcoin's past drawdowns are instructive but not deterministic. Key patterns:
- Deep, fast drawdowns (2013, 2017–2018, 2021–2022) were typically followed by multi-year recoveries that produced large gains for patient holders. Post-2018, BTC took ~3 years to recover to its previous cycle peak; post-2022, the recovery was measured differently due to new macro and institutional contexts.
- Shorter, sharper crashes often offered buying points that paid off within months (e.g., the March 2020 COVID crash), but timing matters: entry during the very bottom rarely happens on plan and often requires luck.
- Volatility clustering and regime shifts: the speed and source of selling changed as derivatives and ETFs grew. Liquidity holes can make brief price moves deeper than fundamentals alone justify.
Two caveats:
- Past returns are not guarantees—structural market shifts can change the expected outcomes. On-chain research firms have recently raised concerns that Bitcoin's structural trajectory may be weakening; some argue the asset could be entering a prolonged downturn rather than an orderly multiyear recovery (see the CryptoQuant analysis later).
- Heavy leverage and institutional orderflow can amplify drawdowns and change the shape of recoveries.
Dollar-cost averaging vs. lump-sum during a crash: frameworks that actually work
Choosing between DCA and lump-sum is ultimately about probability and psychology.
Why dollar-cost averaging (DCA) often fits retail investors
- DCA reduces timing risk: by spreading entries you avoid concentrating at a local top or a liquidity cliff.
- It reduces emotional friction—stick to a schedule instead of guessing a bottom.
- DCA fits limited capital and people with ongoing savings: buy monthly or weekly slices as volatility spikes.
Practical DCA rules in a crash:
- Convert a planned allocation into a multi-tier DCA: e.g., commit 40% immediately, 60% over 6–12 months in equal tranches.
- Increase tranche size during ‘structured’ scare events (exchange reserve spikes, major derivatives liquidations) but avoid chasing a single sharp candle.
When a lump-sum (or partial lump-sum) makes sense
- You have high conviction, enough dry powder, and a risk tolerance for short-term drawdown.
- You see cluster signals (technical support + strong on-chain accumulation by long-term holders + benign derivatives structure).
Rule-of-thumb lump-sum approach:
- Consider a split buy: immediate 50% if macro and on-chain signals align, then DCA the rest.
- Cap any single crash lump-sum to a percentage of investible assets (e.g., 1–5% of total portfolio for conservative retail; higher only if you can tolerate significant drawdowns).
Retail framing from practical guidance
Retail-focused frameworks emphasize capital preservation and cash management—don’t bet what you can’t afford to lose. A recent practical primer on buying during crashes provides retail-oriented decision steps and behavioral guardrails that are useful when structuring DCA or lump-sum plans. (see: Should you buy Bitcoin in a crash?).
Technical signals and on-chain metrics to watch
Your buy-the-dip checklist should combine price-based technicals and on-chain metrics. Below are the most practical signals to monitor and how to interpret them.
Mayer Multiple and the 365-day moving average
- Mayer Multiple = price / 200‑day moving average (original Mayer used 200-day); variations use different MAs. Historically, low Mayer Multiples have correlated with attractive long-term entry points, while very high multiples signal overheating.
- The 365‑day MA acts as a long-term trend filter: price below this MA during a crash signals a bear regime; price holds above it—or reclaims it—suggests trend resilience.
How to use them together:
- Conservative rule: avoid large lump-sum buys when Mayer Multiple is above historical cycle medians and price is below the 365‑day MA; favor DCA instead.
- Aggressive rule: if Mayer Multiple hits cycle lows and long-term holder accumulation rises, consider a larger allocation.
Exchange flows, reserves, and realized metrics
- Net exchange inflows: sustained inflows often signal selling pressure—if exchanges accumulate balances fast, that is a risk for further price stress.
- Exchange reserves dropping while long-term holder balances increase is a bullish compositional change.
- Realized price, MVRV, SOPR and age bands: when realized price stays well above market price and SOPR collapses, short-term sellers are capitulating—this can mark local bottoms.
Liquidity heatmaps and orderbook clusters
Technical scanners that map orderbook liquidity and clustered limit orders can identify ‘bear zones’ where liquidity is thin or large sell orders concentrate. A recent market alert mapped a specific bear-zone and liquidity cluster around high-order volume levels—these kinds of heatmaps can inform where sharp falls may stall or accelerate, and should factor into entry sizing during a crash (see the technical warning here: bear-zone alert near 74k orders).
On-chain research that pushes back on unconditional accumulation
Not all on-chain charts are bullish. Some analytics groups argue that structural metrics—declining network growth, muted on-chain demand versus post-halving expectations—could indicate a prolonged period of underperformance rather than a straightforward rebound. Consider those analyses as a counterbalance to accumulation narratives (example: CryptoQuant’s warning on potential structural decline: CryptoQuant analysis).
Practical risk-management steps for retail investors
A buying plan without risk controls is risky in itself. Here are practical steps to manage downside during high-volatility sell-offs.
- Position sizing: size any single trade to a small fraction of investible assets (e.g., 1–5% for conservative retail). Scale positions higher only if your financial situation supports it.
- No leverage: avoid margin during crashes—liquidations amplify losses and can create firefighting behavior.
- Use limit orders and staggered entries: set limit bids across a price range instead of market orders in thin liquidity.
- Maintain a cash buffer: keep cash to buy more if conditions worsen—forced selling to meet non-investment expenses is a common mistake.
- Custody & exit plan: decide custody in advance (self-custody vs. custodial services) and set tax-aware exit rules.
- Mental stop-loss: instead of hard automated stops which can be gamed in thin markets, set a pre-committed re-evaluation point (e.g., “if BTC falls another 25% and institutional flows collapse, reduce exposure”).
Why institutional flows and derivatives structure complicate buy-the-dip
The market microstructure has evolved. These changes mean that classic buy-the-dip heuristics don’t map perfectly onto current dynamics.
- ETF and institutional flows: large inflows or outflows from spot and futures ETFs can move price significantly and create asymmetric liquidity events.
- Futures open interest and funding rates: crowded long positions funded by negative funding rates can trigger sharp deleveraging if funding flips and longs liquidate.
- Options skew and put-buying: heavy put demand can either be hedging (dampening downside) or speculative hedging that creates asymmetry in market makers’ hedging flows; both change how dips unfold.
- Liquidation cascades: concentrated leverage pockets can turn a modest sell-off into a larger crash when stops and margin calls cascade through exchanges.
These structures mean a dip can overshoot fundamentals and stay below historical support levels for longer—exactly why a combined technical + on-chain + flow-aware approach is necessary. Coinpaper’s liquidity heatmap example shows how these microstructure points can become visible in orderbook data during stressed moments.
A simple checklist to decide whether to buy during a crash
Combine objective signals with your personal finance rules. If you answer most of these “yes,” a scaled accumulation plan is defensible.
- Do I have an emergency fund and no high-cost debt?
- Is any purchase ≤ X% of my investible capital (set X by your risk tolerance)?
- Are core long-term signals aligned? (Mayer Multiple near cycle support, price behavior vs. 365‑day MA, falling exchange reserves or rising long-term holder accumulation).
- Are derivatives/funding dynamics benign (no extreme leverage pockets, stable funding rates)?
- Have I prepared an execution plan (DCA schedule, limit order grid, re-evaluation triggers)?
Example action plan (conservative retail):
- Allocate 40% of planned BTC purchase immediately using limit orders near current levels.
- DCA 60% over 9 months (weekly or biweekly).
- Reevaluate if net exchange inflows spike above a pre-set threshold or if funding rates indicate a deleveraging event; pause new buys until signals normalize.
Putting it in perspective: balanced final guidance
A crash can be a buying opportunity, but it is not automatically the right time for every investor. Use a framework that combines: historical context, technical filters (Mayer Multiple and 365‑day MA), on-chain flows, and strict risk management. DCA generally suits retail investors because it reduces timing risk and emotional errors; a partial lump-sum can be layered in if conviction and market structure align.
Remember: some respected on-chain voices warn of possible structural decline—this is not a reason to panic-sell, but it is a reason to avoid a one-size-fits-all ‘buy everything’ approach. Keep your allocation rules, use staggered entries, and mind derivatives/ETF flows that can change the shape of a dip.
Bitlet.app users and other retail investors should treat accumulation as a process, not a single event.
Sources
- Practical retail guidance on buying in a crash: https://www.fool.com/investing/2026/02/07/if-the-market-ever-crashes-should-you-buy-bitcoin/
- Technical heatmap and bear-zone alert: https://coinpaper.com/14375/bitcoin-price-prediction-bear-zone-alert-near-74-k-orders?utm_source=snapi
- On-chain caution and structural-decline argument: https://www.cointribune.com/en/cryptoquant-warns-of-structural-decline-in-bitcoin/?utm_source=snapi


