How the Options Market Is Pricing a New Implied ‘Floor’ for Bitcoin After a Violent 15% Rally
Summary
Executive overview
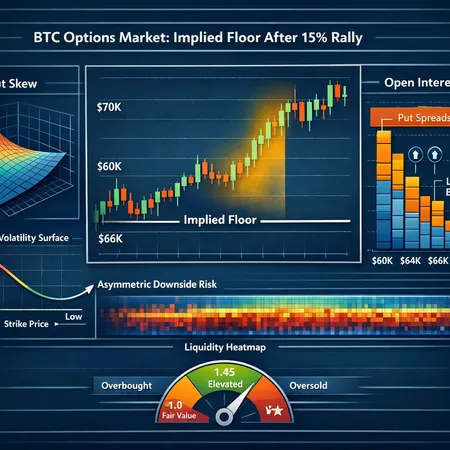
The options market often speaks before the cash market. After Bitcoin’s rapid ~15% run from roughly $60k to $70k, dealers, hedge funds and prop desks are repositioning — and option prices are reflecting a new, market-implied floor. Reading that floor requires looking at three core signals: put skew, put spreads used to replicate digital payouts, and open interest concentrations across strikes and maturities.
This explainer is aimed at derivatives desks and advanced retail traders who want actionable, execution-ready context: how to infer an implied floor from options, why a quick rally creates asymmetric option pricing, how to blend Mayer Multiple and liquidity heatmaps into a derivatives view, and which trades or hedges make sense given the current structure.
How options reveal an implied floor: practical diagnostics
Options are not just volatility ticks — they encode a risk-neutral distribution. There are three practical diagnostics to estimate a near-term floor from option markets.
1) Put skew and risk reversals
Put skew is the difference in implied volatility between puts and calls at equivalent deltas (or strikes). A steep, persistent put skew signals elevated demand for downside protection and a higher market-implied probability mass in the left tail. Traders often monitor the 25-delta put vs 25-delta call skew (or the 10-/25-delta smile) and watch how it changes across expiries: a front-month steepening suggests short-dated tail-risk concern; longer-dated skew moves imply structural protection demand.
How to read it: if the 25-delta put IV is meaningfully above the 25-delta call IV and OTM put vols rise after the rally, the market is effectively pricing more chance of a large reversion down than before — one component of the implied floor.
2) Replicating a digital put via put spreads
A pragmatic way to estimate the probability the market assigns to a floor level is to replicate a cash-or-nothing (digital) put with tight adjacent put spreads. Pricing a tight put spread and scaling it gives an approximation of the risk-neutral density near a strike (a practical version of the Breeden–Litzenberger idea).
Procedure:
- Pick a candidate floor strike (e.g., $65k if you see OI concentration there).
- Buy a narrow put spread around that strike (e.g., 1–2% wide) and annualize/normalize the premium to infer implied probability mass near that strike.
- Repeat across expiries to build a short-term implied CDF. If short-dated spreads imply a nontrivial mass of probability below the strike, traders read that as a priced-in floor (or at least a price region with concentrated protection demand).
3) Open interest, concentrations and dealer flow
Open interest (OI) by strike is the practical ledger of where risk is parked. Large OI in puts at a strike signals dealer hedging: dealers selling those puts will hedge by buying underlying delta or adjusting futures exposures, thereby creating liquidity and flow dynamics that can make that strike a sticky level. Conversely, concentrated call OI can act as a short-gamma ceiling.
Put OI builds + heavy dealer short-gamma → dealers hedge by buying futures as price falls and selling as price rises. The net result is flow-induced support around strikes with heavy put OI, which traders often interpret as an effective floor until that OI is unwound.
For many derivatives desks, Bitcoin option OI is the first place to look for evidence that a $65–70k band has become structurally meaningful.
Why a rapid $60k→$70k move embeds asymmetric option risk
A violent rally is not neutral for options. It transforms exposures across delta, gamma and vega in ways that create asymmetry the market prices into options.
Dealer inventory and gamma: rapid upside pushes many short-delta positions more deeply out-of-the-money, and dealer gamma exposure can flip. Dealers who sold puts or short strangles before the move may end up short significant net gamma, forcing them to buy underlying in sell-offs and sell in rallies — amplifying moves and steepening skew as they re-hedge.
Liquidation-driven flow: in the recent move, liquidation cascades and stop runs contributed to the 15% jump. That type of flow creates sudden squeezes and forced covering that leave residual positioning imbalances which option prices absorb afterward. The CoinPaper note about the liquidation event explains how forced deleveraging can create precisely these large directional swings and leave an options market pricing in a new floor after the dust settles (see the liquidation analysis).
Implied vol dynamics: a rapid rally often compresses realized vol but can elevate short-dated implied vol if tail-risk demand surges. Dealers tighten implied vol on calls (as upside becomes less feared) but may keep put vols rich because of demand — producing a steeper put skew and a heavier implied left tail.
Asymmetric hedging costs: when delta-hedging costs rise on the downside due to illiquidity or funding friction, put premiums embed that risk. The net effect is an implied distribution that is skewed and may show a floor where buyers of protection are concentrated.
Crypto-focused outlets captured this: after Bitcoin rocketed ~15% back above $70k, options desks flagged a newly priced-in floor in the options market even as spot advanced; CryptoSlate covered how the options market was reacting to that move with new implied floors and adjusted skews.
Merge options with Mayer Multiple and liquidity heatmaps for context
Options only tell part of the story — blending technical and liquidity overlays helps evaluate whether an implied floor is durable.
Mayer Multiple and Mayer Z-score
The Mayer Multiple (price divided by the 200-day moving average) and the Mayer Z-score (a normalized distance) are useful to quantify whether current price is historically extended. Recent technical analyses have signaled that a rally toward $74k enters a ‘bear-zone’ alert by Mayer metrics, suggesting stretched conditions even as options price a floor (see the Mayer Multiple alert).
How to use them together:
- If options imply a floor near $65–68k but the Mayer Multiple shows price entering an overextended zone, treat the options-implied floor as fragile — protection demand may reprice quickly if mean reversion resumes.
- If both Mayer metrics and options-implied tails align (i.e., Mayer warns of extended prices and put skew is steep), that’s a stronger composite signal that downside is feared and thus that the implied floor is meaningful.
Liquidity heatmaps and order book gaps
Exchange heatmaps (order-book depth by price) reveal where cash-market liquidity thins. After a rapid rally, liquidity often retracts in the new price band — creating gaps between current spot and meaningful resting bids. When option OI clusters near strikes that sit just above or inside those shallow liquidity regions, that combination can create a fragile floor: the options market expects dealers to provide support, but thin spot liquidity means the support can fail under large flow.
Practical monitoring: compare OI clusters to exchange heatmaps and funding rate snapshots. If large put OI rests at $65k but heatmaps show a thin book at $66–69k, that ’floor’ is heavily reliant on dealer hedges and may not survive a large blow-up event.
Translating signals into actionable trades: institutional and advanced retail
Below are trade ideas and execution notes aligned with the current regime: a sharp rally that leaves put skew and OI signaling an implied floor, while technicals like Mayer Multiple flag potential extension risk.
Institutional-grade plays (desks, asset managers)
- Long put spreads to finance protection
- Structure: buy a 60k put, sell a 55k put (sizes and strikes illustrative). Use multiple expiries to ladder protection (e.g., 2-week, 1-month, 3-month). The narrow put spread caps cost while preserving downside insurance.
- Why: cheaper than outright puts; replicates a digital with finite cost and limited assignment risk.
- Vega curve repositioning (calendar spreads)
- Structure: sell short-dated call or put vols that appear rich due to event flow, buy longer-dated vols to express structural tail risk. A front-short / back-long calendar or diagonal limits time decay while exploiting term-structure steepness.
- Why: if short-dated implied vols are elevated (post-rally uncertainty) but long-dated vols are comparatively cheap, the trade benefits if short-term uncertainty fades.
- Collar with financed protection
- Structure: buy protective puts at desired floor, finance by selling upside calls at a strike you’re comfortable capping returns. Use the residual premium to pay for the puts or to reduce cost.
- Why: clean risk-off defensive posture for funds that must remain allocated to BTC-like exposures.
- Sell put fly/OTM vega if you believe the floor is durable
- Structure: sell a wide put fly (sell two wings, buy two outer puts) sized to capture skew convergence.
- Why: a way to monetize a belief that the put skew will normalize and that the floor will hold, but with defined risk.
Execution notes for institutions: consider block liquidity, skew across venues, and how much dealer flow you will trigger. Use mid-OTC desks or block trades for large-sized options to avoid one-way slippage.
Advanced retail plays (experienced traders only)
- Cheap protection via ratio put spreads
- Structure: buy 1 decently OTM put and sell 2 lower-strike puts to offset cost — this reduces upfront cost but creates downside risk below the short strike.
- Caution: requires explicit sizing and conviction; use only if you can accept the short strike assignment risk.
- Short-dated strangle with gamma hedge
- Structure: sell out-of-the-money calls and puts equidistant from spot, hedge delta dynamically (or pre-hedge with futures). Keep position small and monitor gamma exposures.
- Why: if you believe implied vols will compress and that the put skew premium is overpriced relative to realized tail risk.
- Buying tight put spreads to replicate digital protection
- Structure: buy a narrow put spread (1–2% width) centered at your floor. This approximates buying a digital option with lower cost and clearer payout profile.
- Directional risk-reversal
- Structure: buy a put and sell a call (or vice versa) to tilt exposure while financing cost. Useful when you want asymmetry without outright long vol costs.
Execution notes for retail: prioritize liquid expiries and strikes with reasonable OI. Avoid extremely wide spreads on small exchanges, and always size for worst-case assignment or margin impacts.
Risk management, sizing, and practical considerations
- Liquidity: OI is a proxy for liquidity but execution cost still matters. Large OI can mean more passive support, but filling large-sized trades will move the market.
- Slippage and gamma risk: quick reversals create gamma-driven slippage; keep gamma exposure limited or ensure you have the systems to dynamically hedge.
- Funding and margin: options plus futures hedges can create large margin footprints during stress; test waterfall scenarios and worst-case liquidity drains.
- Counterparty and venue risk: prefer centrally cleared venues for large option positions; OTC trades require credit-aware sizing and ISDA terms.
Putting it together: a checklist for desks
- Read the put skew across expiries and watch front-month shifts.
- Replicate a digital at candidate floors using narrow put spreads to estimate implied probability mass.
- Cross-check put OI clusters with exchange liquidity heatmaps to see if the ‘floor’ is flow-supported or fragile.
- Overlay Mayer Multiple/Z-score to understand whether the rally has left price structurally extended.
- Choose execution: put spreads and collars to buy protection, calendar/diagonals to express curve views, and controlled premium selling if you believe skew reverts.
Bitlet.app can be a useful place to quickly scan option chains and OI concentrations while you size and route trades, but always confirm with primary venue order books and OTC desks.
Final note
Options markets rarely lie: they show what participants are willing to pay to avoid outcomes. After a violent rally, that willingness often consolidates into a visible implied floor through skew, OI and dealer hedging flows. The prudent derivatives desk will quantify that floor, stress-test it against liquidity and technical metrics like the Mayer Multiple, and choose hedges that match time horizon, liquidity needs and risk tolerance.
Sources
- CryptoSlate: Bitcoin rocketed 15% to get back above $70,000 — but the options market is currently pricing in a terrifying new floor
- CoinPaper: Why crypto market up today — BTC hits 70k, XRP rockets 25% (liquidation context)
- CoinPaper: Bitcoin price prediction — bear zone alert near 74k (Mayer Multiple discussion)