Decoding the Spot-Bitcoin ETF Inflow Surge: What Institutional Demand Means for the $100K Breakout

Summary
Executive snapshot: not your average inflow week
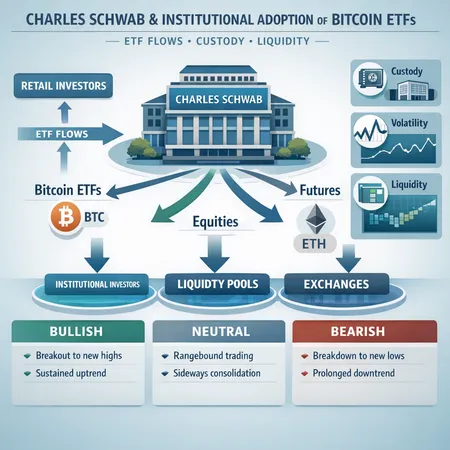
Over the past several trading sessions, spot-Bitcoin ETFs have produced a tidal wave of capital into BTC. Large managers—most visibly BlackRock—led multi-day streaks of inflows that aggregated into the hundreds of millions, punctuating a structural change in how institutional demand is delivered to the market. Cointelegraph reported on the scale of these consecutive inflows and the outsized role of big managers in steering the trend (BlackRock leads $840M Bitcoin ETF inflows). Meanwhile, coverage of parabolic ETF-product receipts captured how quickly net demand can form when institutions move in concert (U.Today on parabolic ETF inflows).
For intermediate traders and portfolio managers, the takeaway is straightforward: this is not retail dip-buying. These are programmatic, institutional-sized allocations that require authorized participants (APs) to source spot BTC, often pulling supply off exchanges or from OTC desks. The result is clear: visible demand, compressed available liquidity, and a bias toward higher prices until supply is replenished.
How ETF flows interact with whales and exchange balances
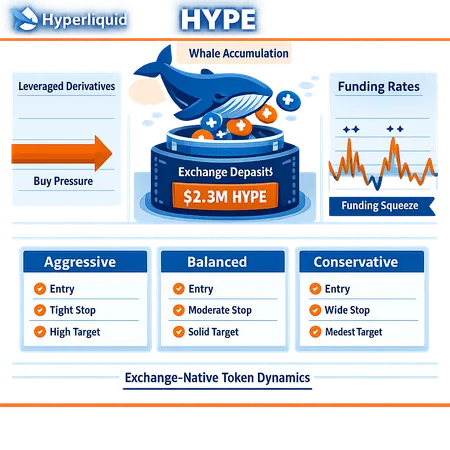
Spot ETFs create a predictable plumbing. When an ETF receives cash inflows, APs buy BTC to back new shares. That mechanical buying competes with other sources of demand: long-term whale accumulation, derivatives positioning, and retail speculative interest.
Two linked on-chain dynamics matter:
- Whale accumulation: Large addresses increasing holdings remove sell-side liquidity. When whales buy in tandem with ETF-driven AP purchases, the market feels thinner and upward price moves need less incremental volume to push higher.
- Exchange balances: ETF buying often coincides with net outflows from exchanges as APs and OTC desks take custody. Declining exchange balances reduce the depth available for aggressive sellers, making rallies more liquidity-driven and potentially more violent.
This interplay is why ETF flows can coincide with rapid BTC re-rates even without aggressive retail FOMO. For many traders, Bitcoin is now a two-tiered market: programmatic institutional demand on one side and a thinner, more reactive liquidity pool on the other. If ETFs keep drawing liquidity, whales can accumulate into these structural gaps, reinforcing the trend.
Bond volatility, macro backdrop, and why it matters now
The macro backdrop has been supportive of risk-taking. Recent analysis shows U.S. bond-market volatility has pulled back to levels not seen since 2021, which typically encourages allocation to risk assets including BTC (Coindesk analysis on bond volatility). Lower bond volatility reduces the hedging penalty for large managers and lowers the perceived macro tail-risk that might otherwise dampen flows into Bitcoin ETFs.
But macro risk is not gone. Upcoming PPI prints and Fed commentary remain live catalysts. A surprise hawkish pivot or hotter-than-expected inflation data can rapidly restore volatility—and with it, the incentive for quick deleveraging. In short: bond volatility is quiet now, which aids the ETF-led bid, but that quiet can snap back, and when it does, flows can decelerate sharply.
Technical anatomy: $97K–$101K as a liquidity corridor
When flows drive prices higher, the market tends to hunt for liquidity—clusters of stops, limit orders, and historical swing levels. Currently, the $97K–$101K zone looks like the most consequential corridor for BTC. Cointelegraph covered market commentary pointing to a $101K reclaim as a structural milestone in a liquidity-driven rally (Cointelegraph on $101K reclaim). Here's how to read the range:
- $97K: Short-term support and a pivot for intraday mean reversion. If ETFs keep buying but sellers step in at the first major retracement level, $97K can act as a recycling level for buyers to add.
- $100K (round number): A psychological and liquidity target where many institutional and retail orders cluster. Crossing and holding $100K triggers algorithmic flows and gamma adjustments in options markets.
- $101K+: A structural reclaim above $101K changes the market's higher timeframe profile — it converts a rally into a breakout scenario that more easily attracts momentum and trend-following capital.
Technically actionable implications:
- A clean reclaim above $101K with volume confirming ETF inflows likely opens a path to the next liquidity magnets higher on weekly timeframes (laddered targets and trailing stops advised).
- Failure to sustain above $100K, especially on falling ETF net flows or rising bond volatility, increases the odds of a mean reversion toward mid-range support and re-accumulation.
Scenarios: sustained demand vs. macro/retail pullback
Think in probabilities and conditional paths. Here are three scenarios to help position size and risk.
Bull continuation (base case if flows persist): ETF inflows remain large, AP buys continue, whales hold or accumulate, exchange balances continue to drop, and bond volatility stays subdued. BTC reclaims $101K, gamma flips in options markets favor delta-hedging that feeds the rally, and momentum managers pile in. Trade posture: scale into directional longs, stagger exposure, use options to buy upside convexity, and keep tight risk controls under $97K.
Liquidity-driven spike then chop (alternative): Massive net inflows cause a fast spike into $100K, but retail FOMO lags and liquidity providers refill; a short-term distribution occurs as profit-taking and derivatives mean-reversion interact. This produces range-bound price action between $92K–$101K for days to weeks. Trade posture: favor dispersion trades, sell premium around stretched intraday moves, and use reduced notional sizing on outright directional trades.
Macro snapback / retail fatigue (risk case): A surprise hawkish PPI or hawkish Fed tone lifts bond volatility. Institutional flows slow or reverse, whales pause accumulation, and retail sellers step in. BTC fails to hold $97K, prompt liquidation widens, and a multi-week pullback begins. Trade posture: protect capital—tighten stops, hedge with inverse ETFs or options, and consider re-entry after clearing liquidity zones.
Practical trade ideas and risk controls
For portfolio managers and active traders, here are concrete ways to express views while managing tail risk:
- Staggered long exposure: Ladder entries on ETF-flow-confirmed pullbacks (e.g., add portions at $98K, $95K), not all-in on the first breakout candle.
- Options overlays: Buy call spreads or long-dated calls to retain upside while capping cost; sell near-term premium if implied vol picks up to finance longer-dated protection.
- Funding/spot pairs: Use perpetual-futures funding spreads to capture income in a mean-reverting environment but size carefully; funding can flip quickly when flows change.
- Hedged accumulation: Acquire spot (or use OTC) while hedging with short-dated puts if concerned about macro prints; this turns accumulation into a defined-risk strategy.
- Event-aware sizing: Reduce position size into macro events (PPI, Fed minutes) and re-assess post-data; flow-driven markets can reverse fast on macro surprises.
Remember to model slippage: ETF-buying can pull liquidity faster than expected, so assume higher market impact for large orders unless using OTC desks.
How to monitor the pulse: metrics that matter
To stay ahead, watch these indicators daily:
- Net ETF flows (institutional flow trackers and AP reporting)
- Exchange spot balances and large address accumulation (on-chain analytics)
- Options open interest and gamma distribution around $100K
- US bond-market realized volatility and the VIX correlation
- Macro calendar: PPI, CPI, FOMC-speak
Combining on-chain signals with flow data is where intermediate traders find an edge. Platforms like Bitlet.app (used here for context) and institutional desks increasingly present combined flow-and-on-chain dashboards that speed decision-making.
Conclusion: flows reshape structure—but do not remove macro risk
The recent streak of spot-Bitcoin ETF inflows has fundamentally altered BTC's near-term price structure by drawing out liquidity and enabling whale accumulation. A sustained institutional bid makes the route to $100K shorter in terms of volume required; reclaiming $101K would be a structural event. But this new regime is not bulletproof. Bond volatility, PPI prints, and Fed communication can quickly change the risk-reward calculus.
For traders and portfolio managers, the prudent approach is conditional exposure: lean into the flow while embedding macro-aware hedges, monitor exchange balances and options gamma, and treat $97K–$101K as the decisive corridor that will determine whether this is a true breakout or a liquidity-fueled pause.
Sources
- Cointelegraph — BlackRock leads $840M Bitcoin ETF inflows: https://cointelegraph.com/news/blackrock-leads-840-million-bitcoin-etf-inflows?utm_source=rss_feed&utm_medium=rss&utm_campaign=rss_partner_inbound
- U.Today — Bitcoin inflows go parabolic as $17B weekly ETF spike stuns bears: https://u.today/bitcoin-inflows-go-parabolic-as-17-billion-weekly-etf-spike-stuns-bears?utm_source=snapi
- CoinDesk — Bitcoin bull case grows as U.S. bond-market volatility sinks: https://www.coindesk.com/markets/2026/01/15/bitcoin-bull-case-grows-as-u-s-bond-market-volatility-sinks-to-lowest-since-2021
- Cointelegraph — Bitcoin bottom signal; BTC eyes unique $101K bear-market reclaim: https://cointelegraph.com/news/bitcoin-bottom-signal-btc-eyes-unique-101k-bear-market-reclaim?utm_source=rss_feed&utm_medium=rss&utm_campaign=rss_partner_inbound