Year-End Technical Roundup: ETH Head‑and‑Shoulders, BTC Double‑Top Echoes, SUI & WLD Trade Plans
Summary
Quick market framing
End-of-year technicals are rarely neat; patterns overlap and on-chain flows often accelerate moves beyond textbook measured-moves. This roundup focuses on actionable technical analysis — not narrative — so you can build a trade plan with entries, stops and targets for ETH, BTC, SUI and WLD. For many traders, Bitcoin remains the market bellwether, while Ethereum sets tone for alt liquidity. Bitlet.app can be useful to automate layered buys or set recurring position sizing as part of your plan.
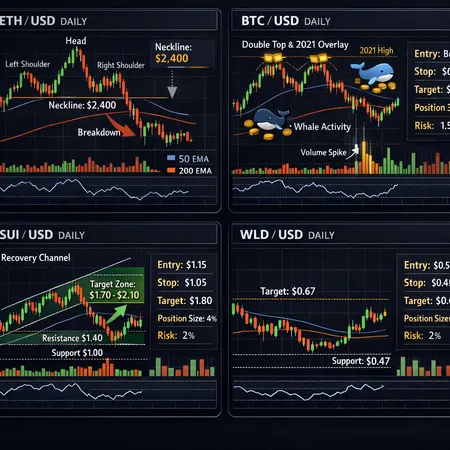
ETH — Head‑and‑Shoulders: what to watch and how to trade it
The technical risk on ETH right now is a potential head‑and‑shoulders topping pattern. The left shoulder, head and right shoulder are visible on daily/4‑hour charts; the critical item is the neckline. If that neckline breaks decisively on volume, a measured move points materially lower — analysts are flagging downside toward $2,400 if key support fails (NewsBTC analysis).
Key levels (technical checklist)
- Immediate resistance (short-term): $3,000–3,200 (reacts to failed rallies).
- Near-term support / neckline: $2,600–2,500 (watch for clean daily close below).
- Measured-break target on confirmed neckline breakdown: $2,400 (and then the next structural zone around $2,200).
Trade plan (ETH)
- Setup A — Short on break: Enter short on a daily close below $2,500 with increased volume. Entry: 1/2 position at break; add 2nd 1/2 on retest of neckline.
- Stop: just above the neckline retest zone, e.g. $2,650–2,700.
- Targets: first profit take $2,400 (50% of position), trailing stop or second target $2,200.
- Position sizing: risk no more than 1–2% of portfolio per full position. If stop distance is wide, reduce size.
Risk notes
- False breakdowns are common; require volume confirmation or on‑chain outflows for conviction.
- If price repels strongly off $2,600 and makes higher highs with volume, invalidate the H&S and switch to neutral/bullish bias.
BTC — Double‑top echoes and whale-driven downside
Several technicians are comparing current BTC action to 2021 double-top dynamics. Historical analogs matter because behavioral flows repeat: large holders (whales) can trigger swift declines through concentrated selling or transfers to exchanges. Recent analysis ties current price action to similar whale/shark wallet activity that preceded sharp pullbacks in earlier cycles (CoinSpeaker comparison).
Structure and levels
- Pattern: potential double-top with a prominent neckline. A failure of that neckline can accelerate selling.
- Key support (neckline) to watch: ~$40,000 (use your timeframe and chart to refine this to your style).
- Measured move on clean breakdown: $28,000–30,000 range (distance from top to neckline projected downward).
Trade plan (BTC)
- Setup B — Protective short or hedge: Enter a short or add hedges (options/short futures) on a confirmed daily close below neckline with elevated on‑chain outflows.
- Entry: small starter size at breakdown; add on momentum / increased exchange inflows / whale transfer signals.
- Stops: above the neckline; keep them tight relative to timeframe (daily traders: stop above daily close retest).
- Targets: scaled targets at $35k, $30k, $28k (take profits progressively).
- Alternative long plan: if BTC holds above neckline and reclaims it with volume, look for long re-entry on clean retest.
On‑chain overlay
- Watch whale addresses, exchange inflows, and concentration metrics. Historically, double-top declines were exacerbated by large transfers and accumulation in fewer hands. Use these signals to time adds or trim exposure.
SUI — The bullish technical setup: $1.70–$2.10 recovery zone
SUI has formed a constructive bullish divergence on shorter timeframes, testing resistance after finding support around $1.33. Recent technical commentary suggests a recovery zone between $1.70 and $2.10 if bullish momentum continues and the $1.33 support holds (Blockchain.News SUI update).
Key levels and rationale
- Support: $1.33 — the invalidation level for the bullish thesis.
- Immediate resistance: $1.70 (first target/zone to prove continuation).
- Extension target: $2.10 if $1.70 breaks with conviction and volume.
Trade plan (SUI)
- Setup C — Momentum long: Enter long on a sustained close above $1.50 with volume, or dollar-cost-average (DCA) below $1.50 with a hard stop below $1.33.
- Stop: $1.30–1.32 (just below $1.33 to allow for noise).
- Targets: partial take at $1.70, second take at $2.10.
- Position sizing: because alt volatility is higher, risk per trade should be smaller (0.5–1% of account per trade).
WLD — Range trade between $0.47 support and $0.67 target
Worldcoin (WLD) looks like a clear range setup: support near $0.47 and an actionable upside target around $0.67 if buyers step in near support and structure holds (Blockchain.News WLD update).
Trade plan (WLD)
- Setup D — Range long / mean reversion: Buy near $0.47–0.50 with tight stops below $0.45.
- Stop: $0.44–0.45 (invalidates support).
- Targets: partial at $0.58, full or trailing at $0.67.
- If WLD breaks $0.47 on volume, switch to short bias with a measured move to lower structural levels.
Cross‑ticker risk management and position sizing
- Risk per trade: default to 1% of portfolio equity for major tickers (BTC, ETH); 0.5–1% for higher‑vol alts (SUI, WLD).
- Correlation: remember BTC/ETH correlation often spikes during selloffs. Reduce aggregate crypto exposure if both setups are directional in the same way.
- Stop discipline: set stops before the trade and size positions to that stop. Avoid moving stops farther away to “buy time.”
- Stress testing: if multiple stops hit simultaneously, limit cumulative drawdown to a pre-defined maximum (e.g., 5–7% of capital) before reassessing the market environment.
Practical trade checklist (printable)
- Define your timeframe (swing vs. intra-week).
- Mark pattern and exact levels on your chart (neckline, shoulders, support, targets).
- Confirm with volume or on‑chain signals (especially for breakdowns): higher volume on break increases conviction.
- Set entry, stop, and two staged targets; size position by stop distance and risk %.
- Use a mental plan for scenarios: invalidation, continuation, false break.
- If running profits, trail stops using structure (higher lows on longs / lower highs on shorts).
Final notes and nuance
Technical patterns give measured maps, but market microstructure and on‑chain flows control execution and speed. For ETH, the head‑and‑shoulders remains conditional — demand a decisive break and volume. BTC comparisons to 2021 are helpful, but not definitive; watch whale wallets and exchange flows for confirmation. For SUI and WLD, smaller-cap liquidity means fast moves; keep position sizes modest.
If you use tools for recurring buys or installment strategies, integrate them into your trade plan but keep them disciplined — automation should enforce your stop and size rules, not replace them. Bitlet.app can be part of that execution stack when layering across levels.