Why XRP Surged: ETF Inflows, SWIFT GPI & R3 Corda Tests, and the $2.30 Case
Summary
Executive snapshot
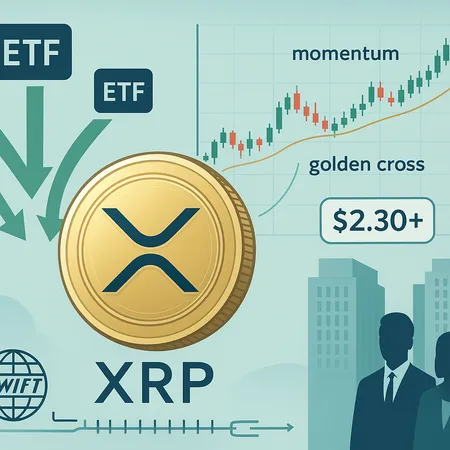
XRP’s latest breakout is not the product of a single headline but of several coordinated developments that matter to portfolio managers: concentrated ETF demand on launch day, a chart-based momentum shift (the hourly golden cross), and positive real-world payments tests involving SWIFT GPI and R3 Corda. Each element alone would move markets that are already thin; together they compressed supply and pushed price action higher.
For many traders, Bitcoin still sets market sentiment, but XRP’s narrative has shifted toward being both an investable ETF-backed asset and a payments rail candidate — a dual story that changes how institutions and allocators might size exposures. Bitlet.app users looking to rebalance should weigh both flows and technicals before adding fresh allocation.
Day-one ETF flows: how much demand landed and why it mattered
Spot ETF launches can act like a vacuum on available circulating tokens: managers must acquire real XRP to back shares. Industry reports documented significant day-one activity. Franklin and Grayscale’s new products were associated with notable accumulation and trading volume — Coinpaper estimated millions of XRP accumulated and tens of millions traded on day one, while another report highlighted a single-day inflow of roughly $164 million into the new ETFs as part of the initial demand wave.
These figures matter for price mechanics. When custodians and APs buy tokens to seed ETF inventories, buy-side pressure hits the on-chain supply and order books. That tightens liquidity, exacerbates moves, and can convert short-term technical breakouts into multi-day trends if flows persist. See reporting on day-one volumes and inflows for the specifics: Coinpaper’s day-one trading breakdown and Blockonomi’s coverage of the $164M inflow give a clear picture of how concentrated demand became.
Chart momentum: the hourly golden cross and what it signals
Technically, analysts noted an hourly golden cross for XRP — a shorter moving average crossing above a longer one on the hourly timeframe. That pattern is a classic momentum signal signaling that short-term buyers have gained control and that intraday momentum could extend.
Golden crosses work best when confirmed by volume and flow context. In this case the technical signal coincided with the ETF buying wave and higher-than-normal trading volumes, which increases the chance the hourly bullish bias translates to higher timeframes. Still, momentum indicators can fail: if ETF flows slow or selling emerges at key resistance, the golden cross can reverse into a bearish crossover quickly. U.Today’s technical piece documenting the hourly golden cross gives the immediate chart context.
Payments integration: SWIFT GPI + R3 Corda Settler test and institutional rails
Beyond ETFs, a separate but complementary narrative is institutional utility. Recent tests involving SWIFT GPI and R3 Corda Settler put XRP into practical payment-rail conversations. The R3 and SWIFT experiments are not mere PR exercises — they demonstrate interoperability scenarios where XRP can settle cross-border transfers faster and cheaper than legacy correspondent banking in certain workflows.
Why does this matter for price? Institutional adoption implies recurring demand outside speculative markets: treasury departments, broker-dealers or large corporates that route payments via these rails need on-demand liquidity. If settlement volumes using XRP scale from pilot to production, a new, predictable buyer emerges — different in behavior from short-term ETF flows because it represents operational demand. Coinpaper’s coverage of the SWIFT GPI and R3 tests provides useful context on how these pilots could translate to real-world flows.
Putting the pieces together: why some analysts eye $2.30 and beyond
Analysts projecting targets such as $2.30 (and, in more bullish commentary, higher benchmarks) are combining three inputs: available float and ETF-driven buy pressure, favorable technical momentum, and the growth potential of payments-driven demand.
A simple supply/demand thought experiment: concentrated ETF accumulation and day-one inflows reduce available float. If inflows continue — and real-world settlement use begins to require on-chain XRP for operational liquidity — a relatively modest increase in demand can produce outsized price moves. Analysts referencing upside levels often stress conditionality: sustained ETF inflows, maintained technical structure (support holds), and a runway for payments adoption. CryptoPotato summarizes some of the bullish technical scenarios and the key levels analysts watch, including higher upside if critical supports hold.
That said, $2.30 is not a guaranteed landing point. It is reachable under a favorable confluence — continued inflows, no large sell-side liquidations, and confirmation that institutional payments pilots evolve into regular usage.
Risk factors and the plausibility envelope
Even with ETFs and payments tests, several risks can derail price progress. ETF flow tapering, macro liquidity shocks, regulatory headlines, or a technical failure (loss of hourly/4-hour support) would quickly remove the bid. On the adoption side, pilots can stall; operational integration often takes months to years and may not translate directly into token purchases if custodial or synthetics solutions prevail.
Additionally, ETFs can both create and remove liquidity: authorized participants can redeem shares and unwind token holdings, and arbitrage loops can flip from buy pressure to sell pressure if supply-demand dynamics change. Keep an eye on net inflows vs. outflows and on-chain reserve movements tied to institutional custodians.
Position-sizing framework for investors and portfolio managers
Practical sizing should reflect the dual nature of XRP’s current move: concentrated ETF demand (short-to-medium term) and nascent payments utility (longer term). Below is a rule-of-thumb framework — treat it as portfolio guidance, not personalized investment advice.
Conservative allocator: 0.5%–1.5% of total portfolio. Use staggered entries and strict stops (e.g., below the confirmed hourly/4-hour support). This suits risk-averse managers who want some exposure to potential ETF-driven alpha without overcommitting.
Moderate allocator: 1.5%–4% of total portfolio. Consider adding in tranches as ETF inflows are confirmed across several days and the hourly golden cross holds into higher timeframes. Use trailing stops or size reductions on large inflow news reversals.
Aggressive allocator: 4%–8% of portfolio (only for investors with high risk tolerance). Aggressive sizing is appropriate if you believe in multi-year payments adoption and accept high short-term volatility. Keep explicit rules for rebalancing if ETF net flows reverse.
Position management tips:
- Size relative to flow persistence: if daily ETF inflows remain large (as in the initial reports), add to positions; if inflows fade, reduce exposure quickly.
- Use technical anchors: place stop-losses under high-probability supports (e.g., recent hourly/4-hour moving average confluence). A breakdown of those levels often signals momentum failure.
- Stagger exits: plan partial profit-taking at key resistance bands and increase stop spacing as the trade moves in your favor.
- Correlation monitoring: watch whether XRP’s correlation with broader risk assets rises; if XRP becomes highly correlated with BTC or equities, it may lose idiosyncratic ETF/rail-driven upside.
Practical checklist before adding new XRP exposure
- Confirm ETF flow continuity: monitor daily inflows and on-exchange OTC activity reported by custodians or market trackers (initial inflows were substantial; decide if that pace is sustainable).
- Validate technical structure: ensure hourly golden cross progresses to 4-hour/ daily confirmations or at least that support holds on pullbacks.
- Watch custodial on-chain movements: substantial transfers from exchange or custodial wallets to APs can precede price pressure.
- Track adoption signals: announcements that move pilots toward production or custodial support for cross-border settlement are long-term positives.
Conclusion
The recent XRP surge is best understood as the intersection of concentrated ETF demand and a strengthening payments narrative. The hourly golden cross gave technicians a short-term green light, while SWIFT GPI and R3 Corda tests shifted part of the story toward institutional rails that could generate recurring, non-speculative demand.
That combination makes a $2.30 scenario plausible — but conditional. Portfolio managers should size positions according to flow persistence, maintain technical stop discipline, and avoid treating the event as purely technical or purely fundamental. If you allocate, do so with clearly articulated entry rules, position limits and exit plans. For traders using platforms like Bitlet.app, consider these factors before rebalancing allocations.
Sources
- XRP hourly golden cross confirmed — U.Today
- XRP price jumps 8% as new ETFs pull in $164 million — Blockonomi
- Franklin and Grayscale ETF day-one accumulation and trading — Coinpaper
- XRP gears up for SWIFT GPI and R3 Corda Settler test — Coinpaper
- Analyst bullish levels and key support to hold for XRP upside — CryptoPotato