How Spot‑Bitcoin ETF Flows and Institutional Filings Are Shaping BTC’s Price Path
Summary
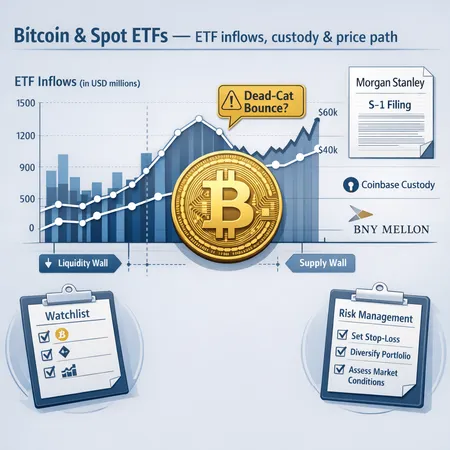
Executive snapshot: why this moment matters
The latest wave of spot‑Bitcoin ETFs has moved ETF flows from a marginal market force to a structural one for BTC. Daily inflows—concentrated in a small number of large products—create a steady source of demand that can support prices, alter volatility regimes and change how market participants hedge exposure. For many traders, Bitcoin is no longer just an on‑chain asset: it is increasingly traded and priced through ETF creation/redemption mechanics and prime‑broker distribution.
Recent headlines show notable net inflows into U.S. spot ETFs, with BlackRock's IBIT among the leaders pushing new demand and headline price moves; Cointelegraph reported cumulative daily flows in the hundreds of millions as markets reacted to that demand and the broader macro backdrop (Cointelegraph). That combination of concentrated flows and headline volatility is why portfolio managers should move from abstract conviction to process: define entry/exit triggers, map liquidity walls and stress‑test for ETF outflows.
How spot ETF flows mechanically affect BTC price (and where fragility shows up)
Spot ETFs create demand by buying BTC to back shares (or by sourcing BTC in the market via authorized participants). When inflows are large and sustained, they:
- Remove available liquidity from spot markets, tightening order books.
- Force market makers to hedge with futures, which changes basis and funding rates.
- Concentrate settlement needs around creation/redemption windows, raising short intervals of execution risk.
That concentration is both a bullish engine and a vulnerability. If a few funds (or one sponsor) drive most inflows, their redemptions or a shift in investor sentiment can produce rapid reversals—ETF outflows can accelerate selling into thin liquidity. Monitoring who is leading flows (for example BlackRock/IBIT) helps identify where the pressure will be strongest in either direction. See the inflow snapshot and leaders in the Cointelegraph piece for context.
What Morgan Stanley’s amended S‑1 signals about institutional custody and distribution
Morgan Stanley’s amended S‑1 filing for a proposed Bitcoin Trust—and the naming of Coinbase Custody and BNY Mellon in that filing—is a meaningful data point for how big financial firms plan to knit the crypto custody stack into existing institutional plumbing (Blockonomi). Key takeaways:
Dual‑style custody model: The presence of Coinbase Custody signals a reliance on crypto‑native custodians for custody expertise and hot/cold key operations. BNY Mellon’s mention signals use of existing bank custody rails for fund accounting, settlement and distribution to traditional institutional channels. Together, they suggest hybrid custody solutions—crypto tech plus bank settlement—are becoming the market standard.
Distribution and trust: Morgan Stanley tying into traditional depositary and custody rails lowers operational friction for large institutional clients. That makes it easier for advisory platforms, pensions and wealth managers to allocate to a product they perceive as a familiar vehicle.
Counterparty and settlement risk matters: Different custodial arrangements change legal wrappers, insurance profiles and recovery playbooks. The specific custodians named in S‑1s are not mere footnotes; they influence perceived counterparty risk and can affect fund flows as institutions vet operational risk.
For active managers, the implication is operational as much as market‑directional: custody choices will shape settlement speed, insurance cover and the ease of cross‑border distribution—factors that affect not only flows but also the willingness of large allocators to commit capital.
The competing narrative: could this be a dead‑cat bounce?
Not everyone thinks the ETF‑driven rally is durable. Some market observers warn that the recent surge could be a dead‑cat bounce—a sharp rebound inside a larger downtrend driven by short covering, thin liquidity and headline buying rather than a broad base of new holders. Finbold summarized this cautious view, pointing to technical and positioning risks that could unwind the rally (Finbold).
Why the skeptic view has teeth:
- Concentrated flows are fickle. If inflows are front‑loaded or driven by momentum allocations, they can dry up quickly.
- Derivative pressure. Overleveraged futures longs can create violent moves on liquidation cascades, especially when ETF buying cannot immediately soak up sell pressure.
- Macro fragility. Rising rates, dollar strength or a sharp risk‑off event can strip risk premia across asset classes, and ETFs are not immune.
That doesn’t mean the ETF narrative is wrong—rather, it highlights that the presence of structural buyers raises the stakes on proper risk management. You should treat headlines (flows, filings) as triggers to update market structure assumptions, not as proof that the trend is bulletproof.
Where liquidity and supply walls are most likely to influence price
Identifying realistic supply and liquidity walls requires blending on‑chain trends, exchange order books and options expiries. Below are practical zones and instruments to watch (use them to build agility around positions):
Exchange supply trends: Declining BTC balances on exchanges suggest less available liquidity for large sell orders; rising balances do the opposite. Watch 24–72 hour spikes in exchange inflows—these often precede short‑term selling pressure.
ETF creation/redemption windows: Large creations can absorb available spot liquidity; large redemptions can force selling into a market that has less depth. Track sponsor daily flows published by ETF providers and aggregated flow trackers.
Options expiries and OI clusters: Weekly and monthly option expiries create price magnets (max pain) and liquidity walls where market makers hedge. Significant concentrated strikes often correspond to strong support/resistance zones.
Order‑book walls and resting liquidity: Large limit orders around round numbers (psychological levels) or previous highs/lows form visible walls. These can repel price moves or, once taken out, accelerate momentum.
Technical zones to watch: After the recent ETF‑driven move toward the low‑to‑mid $70k area (covered in inflow reporting), near‑term support bands tend to form where long‑term holders accumulate—monitor the $60k–$66k range as a broad support cluster and round‑number resistances in the $70k–$76k area as potential supply walls. These ranges are dynamic; pair them with flow and on‑chain data rather than treating them as immutable.
Practical watchlist: the signals that should make you act
Use this short, prioritized watchlist to turn headlines into portfolio actions. Each item is actionable and measurable.
- Daily ETF inflows/outflows and sponsor concentration — Track absolute dollars and the lion’s share by sponsor. If a top sponsor flips from inflows to persistent outflows, tighten risk controls. (See Cointelegraph’s inflow coverage for examples.)
- Creation/redemption notices — Large creations compress basis; large redemptions can precede spot selling.
- Custody and operational notices — Any filings or custodian changes (e.g., mentions in S‑1s like Morgan Stanley’s) can presage distribution changes or operational upgrades that affect demand.
- Exchange balance movements — Rapid inflows to exchanges often precede selling; steady declines usually support higher prices.
- Derivatives metrics: funding rates & open interest — Extreme positive funding rates suggest crowded longs; sudden drops in OI can signal deleveraging.
- Options expiries and concentrated strikes — Identify where the market maker hedges may create supply/demand walls.
- Macro triggers — Fed speak, CPI prints, USD moves: use macro events as potential catalysts for sudden flow reversals.
Quick action rules (examples)
- If net ETF outflows exceed a multi‑day average by 50% and funding rates flip negative, reduce gross exposure by 25%.
- If exchange inflows spike >30% day‑over‑day into a low‑liquidity environment, consider a protective hedge (inverse futures or put options).
- If a major custodian or sponsor files a negative operational notice, assume at least a 24–72 hour increase in execution risk and widen stop bands.
Risk management checklist for managers and traders
Treat this as a process checklist to operationalize the watchlist into resilient portfolios.
- Position sizing: cap any single ETF‑flow‑driven trade to a small percentage of total risk budget; avoid letting one thesis dominate portfolio risk.
- Liquidity buffers: maintain cash or liquid hedges to meet margin calls without forced selling.
- Stop and scenario planning: define stop levels and pre‑define reactions to ETF outflow signals, large custodial news or options pinning.
- Hedging ladder: use a layered hedge approach—short‑dated futures for tactical protection, cheapest put structures for event insurance, and collar strategies for long holdings.
- Counterparty and custody review: ensure your custodian, prime broker or counterparty has clear settlement paths and insurance; note that filings like Morgan Stanley’s S‑1 show how counterparty selection affects distribution and perceived safety.
- Rebalance cadence: set a rules‑based cadence for rebalancing (weekly or monthly) tied to realized volatility and aggregate flows.
- Stress testing: run scenarios where ETFs reverse flows or where a large redemption hits a low‑liquidity window; measure P&L and liquidity needs under each scenario.
Tactical positioning examples (non‑prescriptive)
- Conservative allocator: maintain core BTC exposure via small, slowly accumulating positions; use options to cap downside around major support clusters.
- Opportunistic trader: monitor ETF inflow spikes and buy pullbacks into support bands, but size positions small and use tight time‑based stops.
- Hedged exposure: hold spot + protective puts; reduce tail risk from a sudden ETF outflow or derivative deleveraging.
Whatever your approach, focus on process: define signals, quantify tolerances and standardize responses.
Final takeaways
Spot‑ETF flows have made structural demand a real, measurable force behind BTC—but they also concentrate risk. Institutional filings like Morgan Stanley’s S‑1—naming Coinbase Custody and BNY Mellon—show the market is maturing operationally, even as distribution and custody choices create new vectors of counterparty and settlement risk. Skeptical voices warning of a dead‑cat bounce are legitimate and remind us to treat ETF headlines as inputs for risk‑management rather than proof of a sustained trend.
For portfolio managers and intermediate traders, the practical path is clear: combine flow monitoring, custody awareness, on‑chain signals and derivatives positioning into a single watchlist, and pair that with a disciplined risk checklist. That way, you can lean into structural demand when appropriate while being ready to act if ETF outflows or liquidity squeezes flip the market quickly. Tools that aggregate ETF flows, options concentrations and exchange balances can streamline those decisions—Bitlet.app is one example of platforms attempting to bring those signals together for actionable use.
Sources
- Cointelegraph — Spot Bitcoin ETFs: data on inflows and BlackRock leadership: https://cointelegraph.com/news/spot-bitcoin-etfs-462-million-inflows-btc-surge-73k?utm_source=rss_feed&utm_medium=rss&utm_campaign=rss_partner_inbound
- Blockonomi — Report on Morgan Stanley’s amended S‑1 and custodian mentions: https://blockonomi.com/morgan-stanley-files-amended-s-1-for-bitcoin-trust-moves-closer-to-spot-etf-launch/
- Finbold — Skeptical analysis arguing the rally may be a dead‑cat bounce: https://finbold.com/bitcoin-rally-may-be-a-dead-cat-bounce-warns-market-expert/?utm_source=snapi


