Why March 2026’s $1.32B Return to Bitcoin ETF Inflows Matters for Q2 Allocations
Summary
Snapshot: March's inflows in context
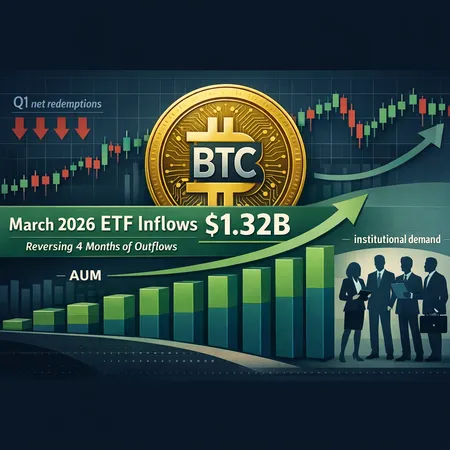
March 2026 closed with roughly $1.32 billion of net inflows into U.S. spot Bitcoin ETFs — the first monthly net inflow since October 2025. Multiple outlets highlighted the shift: Cointelegraph quantified the March gain and placed it against Q1 redemptions, while CoinDesk and Unchained noted that March flows arrived as BTC price stabilization nudged investor behavior back toward ETFs (Cointelegraph, CoinDesk, Unchained Crypto).
That one-month reversal matters for two linked reasons: first, it changes the marginal buyer dynamic after four months of persistent outflows; second, inflows feed ETF AUM, and AUM resilience can shape institutional confidence even if quarterly net flows remain negative.
What flipped in March after four months of outflows?
Three proximate drivers explain why flows resumed:
- Price stabilization and a narrower trading range reduced fear-driven redemptions. When volatility moderates, allocators are more willing to re-enter via passive wrappers.
- Short-term tactical rebalancing at the end of March: some institutions and wealth platforms often rebalance exposures on quarter-end dates, which can produce concentrated flow spikes.
- A change in macro narrative. Late Q1 macro prints and rate commentary made risk-on allocations marginally more attractive, helping convert sitting cash into ETF shares.
Put together, these dynamics allowed ETFs to absorb fresh buy orders without triggering the kind of forced selling that defined earlier months.
ETF mechanics: how creation and redemption move spot BTC
Understanding ETF inflows/outflows requires a quick refresher on mechanics.
- Creation: An Authorized Participant (AP) assembles the required basket (for a Bitcoin ETF, typically BTC) and delivers it to the ETF custodian in exchange for new ETF shares. That process removes BTC from the open market/custody pools and increases ETF AUM. APs sometimes source BTC from exchanges or OTC desks.
- Redemption: An AP returns ETF shares to the issuer and receives BTC (or cash, depending on the product) in-kind. Those BTC can re-enter the open market if the AP or its clients sell them.
Because many spot Bitcoin ETFs allow in-kind settlement, creations and redemptions can be direct channels between ETF demand and spot BTC supply. In practice, market makers and APs smooth the process — they supply liquidity, arbitrage any NAV/share price divergence, and often use futures and options to hedge interim exposure.
Who is the marginal buyer: retail, institutions, or AP arbitrage?
Identifying the marginal buyer is essential because it dictates price elasticity and the likely persistence of flows.
- Retail via brokerages: Large broker-dealers and retail platforms distribute ETF shares to individual investors. Retail inflows can be choppy and sentiment-driven; they can accelerate during rallies and flip quickly.
- Institutional allocations: Pension funds, endowments, and family offices allocating via ETFs tend to be steadier. When institutions are the marginal buyer, flows reflect strategic allocation shifts and are less prone to intraday reversals.
- Arbitrage/AP activity: APs operate to capture small NAV deviations and provide the plumbing for creations/redemptions. Their actions are liquidity-providing but not the same as a long-term buyer; they will flip exposure to hedge P&L.
March’s inflows likely included a mix: tactical institutional reflows (end-of-quarter behavior) plus renewed retail comfort as prices stabilized. That combination is more durable than purely retail-driven inflows but less committed than a sustained institutional program buy.
ETF flows, on-chain supply, and whale behavior
ETF creation has a direct effect on the available BTC supply on exchanges and in OTC channels. When ETFs accumulate BTC into custody, they reduce the floating supply accessible to traders, which can underpin prices, especially in thin markets.
- Exchange liquidity compression: Persistent ETF buying can pull BTC off exchanges into cold custody, tightening order books. That means a given buy order moves price more than it would otherwise — increasing short-term volatility.
- Whale behavior: Large holders watch ETF flows closely. If whales expect continued ETF demand, they can sell into ETFs (locking profits) while anticipating price support. Conversely, if redemptions accelerate, whales may step back or front-run exits by preemptively selling to avoid post-redemption price pressure.
The net effect: ETF inflows reduce available supply and can amplify directional moves; redemptions increase supply and can accentuate drawdowns. For evidence, see the recent market notes showing March inflows coinciding with BTC price stabilization and a modest pick-up in realized volatility (CoinDesk).
AUM resilience: why total assets under management matter for institutional demand
Even when quarterly flows are negative, AUM acts as a liquidity and confidence buffer. Higher AUM means market-makers, brokers, and custody providers have seen larger, more durable pools of capital allocated to the asset class — that reduces operational friction for large allocators.
CoinDesk highlighted that ETF AUM in late March remained relatively resilient compared with October 2025 peaks, which matters in two ways:
- Psychological anchoring: Institutions track peer allocations. Strong AUM signals can shorten the time needed for re-entry after volatility.
- Operational scale: Larger AUM supports deeper AP and market-maker capacity, which smooths trading and reduces implementation shortfall for big orders.
So, March's inflows matter not just for that month’s price action but for the continued credibility of ETFs as a scalable institutional on-ramp.
What ETF flows imply for near-term BTC volatility and macro sensitivity
ETF flows act like an additional layer of market microstructure. Expect these patterns:
- Higher sensitivity to macro surprises: ETFs make institutional channeling of BTC exposure faster. Macro shocks that reorder rate expectations or risk appetite can trigger quick reallocations via ETFs.
- Volatility amplification around flow events: Creation/redemption timings, quarter-end rebalances, and tax windows can produce episodic volatility spikes when ETF demand suddenly accelerates or reverses.
- Asymmetric tail risk: Aggressive redemptions can dump BTC back into the market, temporarily increasing supply. Because supply on exchanges is often thinner after long inflow runs, downside moves can be fast.
In short, ETF flows make BTC more responsive to traditional asset allocation cycles — good for inclusion in multi-asset portfolios, but also a new source of cross-market sensitivity.
Actionable scenarios for traders and allocators (practical, evidence-based)
Below are concise scenarios and suggested responses tailored to portfolio managers and intermediate traders.
Base case — Stabilized price + modest inflows continue
- Positioning: Small tactical add: 1–3% portfolio allocation for strategic investors; traders can maintain directional exposure with limited leverage.
- Risk management: Keep 2–3% of portfolio in liquid hedges (futures or liquid puts) to protect against sudden reversals.
Optimistic case — sustained institutional programs and ~> $2B/month inflows
- Positioning: Increase exposure gradually toward target strategic allocations; use options to express convex bullishness (long-dated calls or call spreads).
- Execution: Scale into size using VWAP algos and OTC desks to avoid front-running by whales.
Bearish case — inflows reverse and redemptions accelerate
- Positioning: Trim leverage quickly; reduce net long exposures. Consider switching to cash or hedged BTC exposure using inverse futures or protective puts.
- Stress tests: Run stress scenarios where ETF redemptions return 2–5% of circulating supply to the market over several days.
Tactical trade ideas for traders
- Volatility sell/roll: If you believe inflows will be steady, sell short-dated implied vol and roll; profits come from realized vol < implied vol. Manage tail risk with long OTM protection.
- Basis play: Use cash/futures basis when futures are in steep backwardation during strong ETF demand; hedge funding cost.
- Options asymmetric: Buy broken-wing call spreads to capture upside while financing cost with a small downside put sale, sized conservatively.
Position sizing rules of thumb
- Strategic allocators (long-term): treat ETFs like an equity allocation — think in % of portfolio not in coin-size. Start smaller when capital markets are uncertain: 0.5–3% and scale as allocation signals confirm.
- Tactical traders: limit single-position exposure to 2–5% of risk capital; cap portfolio leverage and model drawdowns using scenarios that include sudden ETF redemptions.
Use implied-volatility and liquidity metrics to set stop-loss widths; in thin markets, widen stops but reduce size.
Final takeaways for Q2 allocations
March’s $1.32B inflow is important because it marks a behavioral inflection — ETFs can re-attract capital once price action calms, and AUM resilience supports institutional on-ramps even if quarterly flows lag. That dynamic makes ETFs a strategically important vehicle for both portfolio managers and intermediate traders. Expect flows to remain a key cross-check on macro narratives and to shape near-term volatility.
For implementation: treat ETF flows as both a liquidity signal and a supply-change mechanism. Use cash/futures hedges, scale into positions, and size exposures so that a reversal in ETF demand is manageable. For convenience in execution and peer benchmarking, platforms like Bitlet.app provide services for phased allocations and P2P liquidity solutions that some allocators find useful in multi-venue strategies.
Sources
- https://unchainedcrypto.com/bitcoin-etfs-post-first-monthly-inflows-since-october-2025-as-btc-price-stabilizes/
- https://www.coindesk.com/markets/2026/04/01/bitcoin-etfs-post-first-inflows-since-october-as-price-stabilizes
- https://cointelegraph.com/news/bitcoin-etf-1-3-billion-march-first-monthly-gain-2026?utm_source=rss_feed&utm_medium=rss&utm_campaign=rss_partner_inbound
For many traders, Bitcoin remains the primary market bellwether; for portfolio managers, ETF flows are now part of regular allocation conversations alongside macro indicators and on-chain supply metrics. If you want model-ready scenarios, I can provide a simple stress-test spreadsheet mapping ETF redemption rates to expected price impact and margin requirements.