Why 2026 Could See Renewed Downside Risk for Bitcoin: A Multi-Indicator Checklist
Summary
Overview
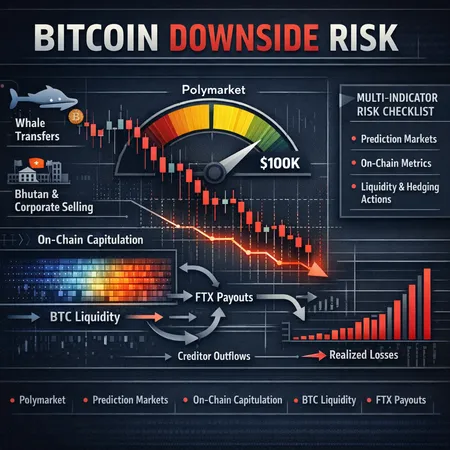
Market signals from prediction markets, on‑chain metrics and active sellers are aligning in a way that increases the probability of renewed downside for BTC in 2026. This piece stitches together three lenses — Polymarket and other prediction markets, on‑chain capitulation indicators, and the potential liquidity shock from FTX payouts and large transfers — into a single risk checklist traders and portfolio managers can use to adjust sizing and hedges. For many participants watching Bitcoin, the operative question is shifting from chasing FOMO to managing fragility.
Prediction markets: Polymarket’s shift and what it means
Prediction markets aggregate dollar‑weighted bets from sophisticated participants; they’re not infallible, but they are an early warning system when sentiment shifts materially. Polymarket recently priced a >50% probability that BTC will trade below $45,000 by 2026, a notable tilt toward caution (coverage of that move is here). Simultaneously, the odds of a $100K BTC this year have declined in those markets, reflecting reduced conviction for near‑term blowoff rallies.
Why this matters: prediction market moves compress a wide range of expectations into one easily monitored metric. A sustained rise in the implied chance of a deeper drawdown suggests that market participants are increasingly pricing in catalysts for weakness — and are prepared to risk capital on that view. For portfolio managers, this should act as a conviction amplifier to prioritize risk control rather than a trigger to liquidate everything.
On‑chain capitulation: five monthly declines and realized losses
On‑chain analytics point to capitulation features: several metric suites flagged capitulation after BTC recorded five consecutive monthly declines. These patterns typically coincide with weaker demand from long‑term holders, rising seller dominance among short‑term players, and diminished liquidity at higher price levels (analysis and signals summarized here).
A related and important datapoint is the share of supply currently underwater. Recent reporting highlights that nearly half of BTC supply is below its realized price, which amplifies downside because a larger population of holders is sensitive to negative price moves. When a significant portion of supply carries unrealized losses, rebounds tend to be shallower — sellers are more likely to realize losses during panic, and buyers have less incentive to step in aggressively.
Liquidity impacts: FTX payouts and concentrated selling
Liquidity events from non‑market actors can materially alter short‑term dynamics. The beginning of FTX creditor distributions — approximately $2.2 billion being returned to creditors — introduces a measurable liquidity shock as cash and claims reenter private hands (reporting on the payouts is here). Not all recipients will sell; many may face tax or cash needs that encourage monetization, which effectively increases available sell liquidity.
Compounding the risk is visible large‑wallet activity. Recent coverage documented a whale moving roughly $74 million to Binance at a realized loss, an action that often precedes OTC sales or exchange liquidity events (see coverage here). When creditor liquidity, institutional rebalancing and opportunistic whale selling converge, they can overwhelm shallow bids and accelerate markdowns.
How to translate these signals into positioning
When prediction markets, on‑chain capitulation signals and incoming liquidity events line up, it’s prudent to treat the environment as higher‑risk for asymmetric downside. Below is a prioritized checklist and tactical playbook for intermediate traders and portfolio managers. Use it as a flexible framework tailored to mandate, horizon and liquidity needs.
Multi‑indicator risk checklist (prioritized)
- Monitor prediction markets weekly — Polymarket and other platforms: an elevated implied probability (e.g., >40–50% for a deeper drawdown) should trigger sizing reviews.
- Track on‑chain capitulation monthly: five consecutive negative months, rising realized losses and shrinking long‑term holder accumulation are red flags.
- Estimate liquidity reuse from major payout events (FTX payouts): project the percentage of recipients likely to sell vs hold and stress‑test order books accordingly.
- Watch exchange inflows and whale transfers in real time: sustained inflows to centralized venues or repeated transfers to exchanges often precede price pressure.
- Quantify supply health: a high share of supply underwater suggests shallower recoveries and a higher probability of forced selling.
- Calibrate leverage and margin buffers: reduce allowable leverage and increase cash cushions if multiple indicators breach thresholds.
Tactical sizing and hedging playbook
- Reduce exposure in stages: trim core BTC positions incrementally (for example, 10–25% across predefined trigger points) to avoid poor timing.
- Use options for asymmetric protection: consider buying long‑dated puts or put spreads and collars to cap downside while preserving upside.
- Increase cash/stablecoin allocations: higher cash gives optionality to buy into volatility and reduces forced selling risk.
- Hedge delta selectively: use futures or swaps to hedge a portion of exposure (10–30% depending on risk tolerance).
- Favor staged re‑entry: set staggered limit buys to rebuild positions if price dislocations occur.
- Stress test liquidity: confirm access to liquidity lines and ensure margin capacity to avoid forced sales in a crowded liquidity squeeze.
Practical scenario modeling (example)
Consider a fund with a 5% strategic BTC target allocation. A simple three‑scenario plan might look like:
- Base case (40% probability): keep 5% allocation, reduce leverage, set a 20% intra‑month haircut trigger.
- Bearish case (40% probability): prediction markets and on‑chain indicators imply deeper downside — trim BTC to ~3% and buy a 6‑month put spread protecting a 25–30% drop.
- Shock case (20% probability): liquidity event plus whale selling causes rapid sell pressure — reduce BTC to 1–2%, park proceeds in cash, and deploy staggered limit orders to re‑enter.
This structure keeps upside optionality while systematizing risk control and liquidity preservation.
Nuance and caveats
Prediction markets are sentiment indicators, not precise timing tools. A >50% Polymarket probability is meaningful, but not a deterministic forecast. On‑chain metrics can lag behavioural shifts and should be read alongside order‑flow and macro liquidity conditions. Not every FTX payout recipient will sell immediately — tax, lockups and behavioral considerations matter. And changes in market structure (miner behavior, derivatives liquidity, OTC absorption) can alter how these indicators play out.
Finally, execution matters: when liquidity becomes stressed, slippage and market impact rise. Ensure execution pathways and settlement processes are robust before increasing hedges or scaling positions — platforms such as Bitlet.app provide a range of entry and exit options that should be considered when planning trades under stressed conditions.
Conclusion
The co‑movement of prediction market pricing, on‑chain capitulation signals including five consecutive monthly declines, substantial realized losses across supply, and potential sell pressure from FTX payouts and whale transfers raises a credible case for heightened downside risk to BTC in 2026. For intermediate traders and portfolio managers the most pragmatic response is disciplined: adopt a multi‑indicator checklist, implement staged sizing and hedging actions, and preserve liquidity to take advantage of dislocations rather than be forced to react to them.
Sources
- https://aped.ai/news/polymarket-favors-bitcoin-drop-below-dollar45k?utm_source=snapi
- https://beincrypto.com/bitcoin-on-chain-capitulation-bottom-signals/
- https://cryptoslate.com/2b-ftx-payouts-begins-today-bitcoin-liquidity-test/
- https://zycrypto.com/bitcoin-whale-panic-74m-moved-to-binance-at-56m-loss-while-nearly-50-of-btc-supply-stays-underwater/