Altcoin Sell Pressure Hits a Five-Year Extreme: On-Chain Evidence, TRX Resilience, and How to Rotate
Summary
Executive snapshot
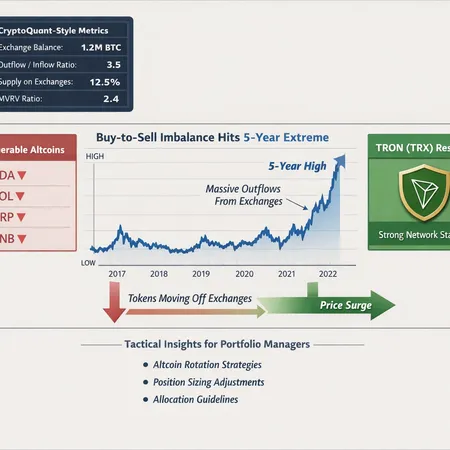
CryptoQuant’s buy-to-sell imbalance recently signaled what some outlets call a five-year extreme in altcoin sell pressure — a cumulative negative imbalance in the hundreds of billions of dollars that implies sustained net selling on exchanges for many altcoins. ZyCrypto summarized the scope of that reading and the headline-sized figure that grabbed attention: a negative $209B cumulative buy-to-sell imbalance for altcoins over the measured period, highlighting especially visible pressure on names like ADA, BNB, SOL and XRP. While that sounds dire, the on-chain story is nuanced: many tokens are simultaneously leaving centralized exchange custody (a bullish sign), retail flows are rotating beyond BTC/ETH on platforms like Robinhood, and a handful of projects — notably TRX — are showing relative resilience. This piece unpacks the data, explains how exchange flows map into price action, and offers concrete, data-driven tactics for rotating into resilient altcoins.
What CryptoQuant’s "buy-to-sell imbalance" actually measures and why it matters
At a practical level CryptoQuant’s buy-to-sell imbalance tracks executed taker buys versus taker sells on exchanges and aggregates those across assets. A net negative figure means more sell-side demand hit the market than buy-side during the measured window. It’s a direct read of order flow rather than off-chain sentiment. That’s why the $209B figure is alarming: it implies sustained taker selling across the broader altcoin cohort.
Why focus on this metric? Because executed order flow has immediate price impact. When taker sell volume outstrips buys, market makers and liquidity providers widen spreads and sellers absorb bids, forcing faster price discovery to the downside. Put simply: persistent negative buy-to-sell imbalance = price pressure, and it tends to compress altcoin valuations until supply is soaked up or buyers step in aggressively.
That said, the buy-to-sell imbalance is not the whole story. It’s a near-term, execution-level signal. Longer-term supply dynamics — notably centralized exchange reserves and large withdrawals to cold wallets or staking contracts — can change the balance of available sellers. That’s where exchange outflows and reserve metrics come in.
Centralized exchange outflows: accumulation or staging for future selling?
A key counterpoint to exchange-based sell pressure is the observation that tokens are moving off exchanges. On-chain watchers often interpret durable outflows as accumulation by long-term holders, staking destinations, or custodial wallets — a reduction in the readily sellable float. But the interpretation depends on destination and timing. Withdrawals to self-custody or staking are generally bullish because they remove tokens from the liquid supply. Withdrawals to OTC/custody or to addresses later associated with large-scale selling are different: they can be staging steps.
To reconcile the two signals: heavy exchange-selling (negative buy-to-sell imbalance) can coexist with net outflows when a subset of market participants are pulling sizeable holdings off-exchange while others are actively selling. The net effect on price depends on which activity dominates in the short term. If taker selling continues to execute against a thinner order book (because of prior outflows), price impact per trade increases — meaning smaller sell volumes can move prices more dramatically.
On-chain ratios and signals to watch (actionable list)
Exchange Reserves (balance change): A falling reserve usually signals accumulation; a rising reserve after price weakness suggests renewed selling pressure. Watch 7/30/90-day trends rather than one-off swings.
Buy-to-sell imbalance (CryptoQuant): Monitor z-score against the last 1–3 years. A 2–3 sigma negative reading flags extreme sell pressure.
Net exchange inflow/outflow (USD value): Size matters — look for multi-week sustained inflows or outflows exceeding average transaction volumes.
Taker buy/sell ratio and orderbook depth: High taker-sell ratio with compressed orderbook depth equals high instantaneous price impact.
Whale non-exchange transfers: Large transfers from exchange to cold addresses, DeFi contracts, or staking validators indicate accumulation by long-term holders.
Concentration of sell pressure: Percentage of exchange reserves held in top exchange addresses; if a few addresses dominate deposits, coordinated selling is more probable.
MVRV / Realized profit metrics: Indicates if selling is dominated by short-term profit-takers or longer-term holders.
Track these metrics for each protocol to generate a per-asset heatmap of vulnerability vs. resilience.
Winners (relative strength) and vulnerable projects — a pragmatic ranking
Not all altcoins react the same. Using exchange flow metrics, on-chain activity and recent price action, we can sketch rough groupings.
TRX (TRON): Relative strength. On-chain data and technical setups show resilience — accumulation patterns, staking engagement, and event-driven narratives have kept TRX less correlated with the broader altcoin sell wave. AmbCrypto highlights TRX’s bullish technical targets despite market slowdowns, and exchange metrics show periods of meaningful withdrawals that suggest strategic accumulation rather than immediate selling. Combine that with active retail interest and you get a candidate for tactical rotation.
BNB: Mixed—structural advantages, but not immune. BNB benefits from exchange-native utility (BNB Chain, discounted fees, token burns) and aggressive buyback/burn mechanics that reduce supply. However, centralized reserve concentration at Binance and regulatory narratives can amplify sell risk during stress.
SOL: High activity, higher vulnerability. Solana’s on-chain activity and developer pull attract flows, but its market has historically amplified volatility because of concentrated holdings and episodic liquidity shocks. When index funds or retail sellers rotate, SOL can see disproportionate moves.
ADA: Slow-moving but stable narrative. Cardano’s staking ecosystem leads to a large locked supply, reducing active sell float. Yet adoption catalysts have been slower, making ADA sensitive to broad sentiment turns.
XRP: Narrative-driven risk. Regulatory overhangs and historical legal uncertainty make XRP’s flows more susceptible to news-driven deposit spikes or withdrawals. Exchange sell pressure can be acute if a liquidity provider needs to exit quickly.
ZyCrypto’s analysis flagged sell-pressure on large caps like ADA, BNB, SOL and XRP — that’s consistent with the idea that widely held, liquid altcoins often lead sell-offs even when smaller cohorts withdraw to custody.
How exchange flows translate to price action — mechanics and scenarios
There are a few repeatable mechanics to internalize:
When exchange reserves drop but outflows are to staking/custody, the market’s available float shrinks, increasing the price impact of each sell order; in a vacuum this tends to support prices.
When buy-to-sell imbalance is strongly negative, sellers are executing aggressively. If the market’s liquidity is already reduced by prior outflows, price moves will be larger per unit sold.
Retail rotation (evidence from Robinhood users rotating beyond BTC/ETH) can quickly redirect liquidity into selected altcoins, momentarily offsetting order-flow imbalances. The crypto.news analysis shows how retail flows can reallocate capital into mid-cap alts during dip-buying phases, producing sharp short squeezes or relief rallies.
Coordinated or algorithmic sellers can time executions to exploit shallow order books, creating cascades. Conversely, coordinated accumulation by whales (large non-exchange transfers plus sustained HODLing) can create a durable foundation for a rebound.
In short: the interplay of executed sell orders, the concentration of exchange-held supply, and who’s accumulating off-exchange determines the price outcome.
Tactical strategies for rotating into resilient names
Below are actionable tactics for portfolio managers and altcoin investors to navigate extreme sell pressure without chasing volatility.
1) Define a signal-driven rotation plan
Base rotation triggers on multiple confirming signals: (a) buy-to-sell imbalance normalizing (z-score < -1 to returning toward zero), (b) sustained exchange reserve decline for the target coin, and (c) whale accumulation or increasing staking flows. Avoid single-metric decisions.
2) Construct a core-satellite allocation
- Core (long-term, defensive): 40–60% in BTC/ETH and the largest, most liquid altcoins with healthy on-chain fundamentals.
- Resilient large-cap alts (satellite): 20–35% in a basket that can include TRX, BNB, ADA, SOL depending on signals and exposures.
- Opportunistic small-caps / high-alpha: 5–15% for event-driven plays and short-term catalysts cited in curated lists (see BeinCrypto’s end-of-February picks for examples).
This framework keeps portfolio risk balanced between durable value and selective upside.
3) Position sizing and risk controls
Cap single large-cap alt exposure to 6–12% and single mid/small to 1–4%, scale into positions with limit orders or DCA, and set stop-loss thresholds informed by realized volatility and on-chain liquidity (e.g., stop if taker-sell ratio spikes and exchange reserves rise sharply).
4) Execution tactics
Stagger entries with limit orders below recent liquidity bands, use TWAP/UTP execution for larger blocks, and prefer buying into on-chain-confirmed withdrawals (exchange reserve drops) to reduce the chance of buying right before coordinated sell-offs.
5) Use event-driven windows
Combine technical/on-chain signals with event calendars: protocol upgrades, token unlocks, or governance votes can shift supply dynamics rapidly. BeinCrypto’s curated altcoin calendar identifies end-of-month catalysts that often produce tradable inflection points.
6) Monitor retail rotation and orderflow platforms
Retail platforms can move markets quickly. The report showing Robinhood users rotating beyond BTC/ETH is an important reminder that retail dip-buying can supercharge relief rallies — but it can also amplify reversals if sentiment cools.
Practical watchlist — what to set alerts on right now
- CryptoQuant buy-to-sell imbalance z-score crossing back above -1 for the broad altcoin index.
- 7-day change in exchange reserves for ADA, BNB, SOL, XRP, TRX: alerts when reserves fall >3–5% for 7 days or spike upwards by the same magnitude.
- Whales: single transfers >$1M off exchanges for the ticker in question over 48 hours.
- Taker sell ratio >0.6 sustained for 24–72 hours.
If two or more alerts fire for a token you’re tracking, treat that as a medium-probability signal for rotation or accumulation depending on direction.
Sample allocation for the current regime (illustrative)
- 50% Core: BTC / ETH (non-altcoin core allocation to dampen portfolio volatility)
- 30% Resilient alts: a weighted basket of TRX, BNB, ADA, SOL (weights based on on-chain resilience and exposure limits above)
- 15% Opportunistic: event-driven altcoins and midcaps from curated lists
- 5% Tail risk / high alpha: small caps and memecoins — capital you are prepared to lose
Adjust cadence quarterly or when on-chain regime shifts materially (e.g., sustained reversal of the buy-to-sell imbalance or concentrated exchange restocking).
Final synthesis — a pragmatic stance
The CryptoQuant signal that flagged five-year extreme altcoin sell pressure is a legitimate red flag: executed sells have been large and broad. But layering exchange outflow data, whale transfer behavior, retail rotation patterns, and project-specific fundamentals reveals a more actionable landscape. Some tokens are being accumulated off exchanges and show asymmetric upside if sell pressure abates; TRX is a leading example of such relative strength, supported by both technicals and accumulation narratives AmbCrypto’s analysis. Meanwhile, widely held alts like ADA, BNB, SOL and XRP remain vulnerable to forced liquidity moves even as their long-term narratives differ.
A disciplined rotation strategy — signal-confirmed entries, a core-satellite allocation, strict position sizing, and careful execution — helps managers navigate the regime of extreme sell pressure. Tools that combine on-chain metrics with execution features (including installment buys or systematic dollar-cost strategies offered by platforms such as Bitlet.app) can make implementation cleaner for both retail and professional allocators.
Sources
- ZyCrypto — BNB, Solana, Cardano, XRP sell pressure analysis: https://zycrypto.com/bnb-solana-cardano-xrp-sell-pressure-hits-5-year-extreme-what-it-means-and-why-it-matters/
- AmbCrypto — TRON resilience and technical targets: https://ambcrypto.com/why-tron-is-gearing-up-for-0-45-despite-the-market-slowdown/
- BeInCrypto — Altcoins to watch in late February 2026: https://beincrypto.com/altcoins-to-watch-in-the-final-week-of-february-2026/
- Crypto.news — Robinhood retail rotation beyond BTC/ETH: https://crypto.news/robinhood-users-rotate-beyond-btc-eth-as-dip-buying-grows/
For context on macro liquidity and historical patterns, also cross-check CryptoQuant dashboards and exchange-reserve APIs when implementing the alert thresholds above. For many traders, Bitcoin remains the reference point for portfolio risk allocation, while activity on DeFi protocols often explains where withdrawn tokens reappear.