Decoding the Bitcoin Crash: Mechanics, Signals, and Risk-Managed Responses
Summary
Quick framing: what happened and why it matters
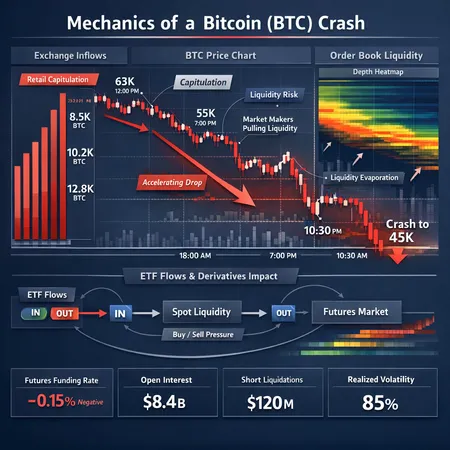
Bitcoin (BTC) experienced a violent down-leg followed by choppy swings that exposed fragile liquidity across venues. The move wasn’t a single-cause event; rather, it was the result of overlapping dynamics: retail-led exchange inflows and capitulation, aggressive market-maker hedging and liquidity withdrawal, and ETF-related and macro liquidity pressures that amplified price moves. For portfolio managers and intermediate traders, parsing those mechanics helps convert noise into measurable signals you can act on.
For many market participants, Bitcoin remains a bellwether asset; its behavior often signals broader risk appetite. Below we unpack the mechanics, cite on-chain and market evidence, and offer practical, metric-based watchlists and risk-management tactics.
Anatomy of the crash: three interacting drivers
The decline and subsequent volatility were not random. They reflected three interacting forces that together create a feedback loop between spot and derivatives markets.
1) Retail capitulation and exchange inflows
On-chain flow data showed a sharp, retail-heavy movement of BTC into exchanges in the run-up and during the sell-off — a classic sign of capitulation. Exchange inflows can indicate intent to sell or to supply liquidity for margin; when inflows spike above normal ranges, price tends to feel extra downward pressure because internal exchange matching is often executed into thinned order books. NewsBTC’s on-chain coverage captured this pattern, highlighting retail-led exchange inflows and signs of capitulation during the slide (see analysis from NewsBTC).
Why this matters: when retail offloads en masse, depth at the bid evaporates and market makers must absorb risk or widen spreads. That creates room for larger price gaps on aggressive market orders.
2) Market makers, liquidity providers and the acceleration effect
Market makers provide two-sided liquidity when volatility is moderate and capital costs are manageable. But when inventories become skewed (e.g., long exposure as price falls), market makers hedge aggressively — often via futures and swaps — which can turn their activity from liquidity provision into price pressure. Investigative reporting indicates market makers likely accelerated the drop to ~$60,000 by aggressively delta-hedging and withdrawing passive liquidity during stressed conditions (see reporting from CoinDesk).
This effect often looks like: widening spreads, thinning displayed depth, and an outsized contribution of aggressive sell market orders matched against fewer bids, which then cascades into larger perp funding shifts and liquidation events. Liquidity providers in DeFi pools can also pull LP capital, compounding the sell pressure.
3) ETF flows and macro liquidity fears
ETF-related flows add another layer. When ETF creations/redemptions or redemption-related hedges occur in a fragile market, they can momentarily increase selling pressure in the spot market or alter arbitrage mechanics between spot and futures. At the same time, macro liquidity concerns — rising yields, bank stress, or policy rhetoric — drive smart money into stablecoins and defensive positions. Analysis of the January rally argued that some of the move was a fake rally as smart money rotated into stablecoins and defensive positions, setting the stage for sharper downside when retail chased the rally and then capitulated (see analysis from Crypto.News).
Coinpedia and other analysts also detailed how broader liquidity and political risks can keep downward pressure on BTC if funding conditions tighten or if institutions pause flow (see CoinPedia). The combination of ETF arbitrage flows and macro liquidity depletion is a multiplier: when market makers hedge ETF-related activity into fragile markets, they can unintentionally accelerate price moves.
Market-micro mechanics that amplify volatility
Understanding the plumbing — funding, basis, order book depth, and liquidation mechanics — clarifies why moves snowball.
Funding rates, basis and hedging loop
Perpetual-future funding rates are the short-term lever connecting leveraged derivatives to spot. When funding goes deeply negative (shorts pay longs), it signals heavy short-side positioning; when it spikes positive, it signals long-side crowding. Rapid changes in funding prompt hedging trades that can push the spot price the opposite way of the initial pressure, especially when market makers rebalance inventory. Watch: sustained funding rate moves beyond normal ranges often precede sharp squeezes or relief rallies.
Order book depth and spread dynamics
Large exchange inflows often hit available bids, revealing liquidity holes where displayed depth is thin. Market makers widen quoted spreads to manage inventory risk, and taker orders walk the book, causing outsized price impact. In stressed moments, the book’s top-of-book liquidity is not a reliable indicator of executed liquidity — the realized liquidity at deeper levels matters.
Liquidation cascades and feedback loops
Leveraged positions sitting near margin thresholds are a fuse. A sharp price move triggers auto-liquidations which force more market orders onto the book, further moving price and triggering additional liquidations — a positive feedback loop. Combine that with market makers hedging directional inventory using futures, and the move accelerates. CoinDesk’s coverage shows how market-maker behavior and hedging likely interacted with leverage to deepen the drop.
Practical signals and metrics to watch (and how to respond)
Below are actionable signals, how to interpret them, and pragmatic responses for traders and portfolio managers. These are metrics you can track in dashboards or build into alerts.
Exchange inflows (spot flows)
- What to monitor: net BTC inflows to exchanges (daily and 7-day rolling) and the composition by wallet cohort (retail vs institutional where available).
- Red flag thresholds: inflows > 2–3 standard deviations above the 30‑day mean; or a spike of several thousand BTC into major exchanges in 24 hours.
- Practical response: reduce spot exposure, avoid market sells; if entering, use staggered limit orders to avoid paying immediate impact.
Futures funding rates & perp basis
- What to monitor: funding rate direction and magnitude, 1-week and 3-month basis between spot and futures.
- Red flag thresholds: funding rate swings outside ±0.03% per 8 hours or basis exceeding normal historic bands (e.g., >3–5% premium on quarterly basis in normal times).
- Practical response: compress leverage, hedge via opposite perp positions, or use options for downside protection.
Open interest and liquidation clusters
- What to monitor: open interest changes, concentrated liquidations on specific exchanges, and clustering of margin calls.
- Red flag thresholds: OI spiking or collapsing >25% in 24–48 hours; repeated large liquidation prints.
- Practical response: flatten large directional OI, widen stop distances to account for increased realized volatility, or reduce allocation to active trading strategies.
ETF premiums, creation/redemption flows, and cash-ETF spreads
- What to monitor: spot vs ETF NAV premium/discount, visible daily creation/redemption activity, and unusual arbitrage flows.
- Red flag thresholds: sudden increases in redemptions or a persistent negative NAV premium indicating selling pressure from ETF redemptions.
- Practical response: anticipate cross-venue pressure; if running directional exposure, account for potential ETF-driven liquidity drains.
Order-book depth and bid-ask spread
- What to monitor: displayed depth at top-of-book (e.g., 0.5% and 1% away), and the size of resting bids vs asks.
- Red flag thresholds: top-of-book depth less than historical percentiles (e.g., below the 10th percentile) and spreads widening materially.
- Practical response: prefer limit orders with price buffers; avoid entering large market orders in thin books.
Stablecoin flows and treasury rotations
- What to monitor: large inflows into stablecoin treasuries, increased stablecoin balances on exchanges, and sudden growth in stablecoin market caps.
- Red flag thresholds: accelerated stablecoin minting or balance shifts that coincide with exchange inflows.
- Practical response: watch for smart-money risk-off signals and consider defensive rebalancing or liquidity buffers.
Option-implied skew and term structure
- What to monitor: put/call skew, volatility term structure, and large block trades in the options market.
- Red flag thresholds: steepening put skew and backwardation in short-dated vols.
- Practical response: use puts or call spreads to hedge tail risk; avoid selling tails in stressed environments.
Historical parallels and what they teach us
Crashes with similar mechanics include March 2020 (global liquidity shock), May 2021 (liquidity withdrawal and on-chain selling), and parts of 2022 (macro tightening). Each event combined derivatives-led dynamics with spot liquidity drains, though the triggers varied.
Two lessons repeat across episodes:
- Liquidity is endogenous: it can evaporate when most needed because participants prioritize capital preservation.
- Hedging activity can become a source of price pressure: what starts as risk management (delta-hedging) can amplify moves when positions are large and markets are shallow.
The January decoupling analysis underscored how smart money rotated into stable assets ahead of retail-driven rallies; when the retail bid collapsed, the disconnect magnified the downside move (see Crypto.News analysis). Use history to set scenario probabilities, not as a one-to-one template.
Risk-management tactics for spot and derivatives traders
These are practical techniques you can implement now.
For spot traders and portfolio managers
- Size positions to liquidity: limit the portion of daily volume you would need to transact to exit a position (e.g., don't exceed X% of 24h ask depth if you need to exit within a day). Use limit orders and staggered execution.
- Maintain a liquidity buffer: keep a portion of the portfolio in cash/stablecoins to meet margin calls and to take advantage of dislocations.
- Use staged rebalancing: avoid large single trades; tranche into exposure over days with pegged limit orders.
For derivatives traders
- Reduce gross leverage when funding or open interest diverges from historical norms. Lower leverage reduces liquidation probability.
- Hedge directionally with inverse instruments or options (protective puts, collars). Options can cap downside while keeping upside optionality.
- Monitor mark price vs index: some exchanges use different mark price calculations — be aware of where your positions will be liquidated.
- Avoid one-way risk: market makers in stressed markets may enforce larger-than-expected hedges; keep both sides of the book manageable.
Operational controls and risk hygiene
- Stress-test scenarios: run daily or weekly drills assuming 15–30% adverse moves and quantify P&L and margin impact.
- Counterparty diversification: spread exposure across multiple venues to avoid exchange-specific outages or liquidity black holes.
- Trade cadence discipline: avoid forced decisions under duress; predefine limit and stop levels and stick to them unless new data justifies changes.
Bitlet.app and other platforms provide monitoring tools that make many of these metrics easier to watch in real time — but human judgment remains central in stressed markets.
Pragmatic checklist for the next 30 days
- Set exchange-inflow and funding-rate alerts at 2–3 sigma above mean.
- Reduce leverage or hedge if OI or perp basis spikes sharply.
- Use limit orders and stagger execution to avoid market impact.
- Keep a cash buffer equal to expected margin needs under a 20% adverse move.
- Monitor ETF creation/redemption notices and large stablecoin flows.
Conclusion: adapt to a liquidity-driven market
The recent BTC crash and volatile swings were not purely about sentiment — they were a liquidity story writ across on-chain flows, market-maker hedging, ETF mechanics, and macro balance-sheet conditions. For traders and portfolio managers, the productive response is metric-driven: watch exchange inflows, funding and basis, OI and liquidations, and ETF flows; calibrate leverage and use hedges; and prioritize operational readiness.
Markets can remain dislocated for some time. That’s both a hazard and an opportunity. The difference between being run over and profiting from volatility is often a combination of timely signals, conservative sizing, and discipline.
Sources
- On-chain data shows retail-led exchange inflows and capitulation
- Investigation on how market makers likely accelerated Bitcoin’s drop to $60,000
- Analysis arguing January’s rally was a fake rally as smart money rotated into stablecoins
- Discussion of liquidity risks and political pressures that may keep Bitcoin under pressure