How the ~13% Bitcoin Difficulty Drop Rewrites Miner Economics: Technical Deep-Dive
Summary
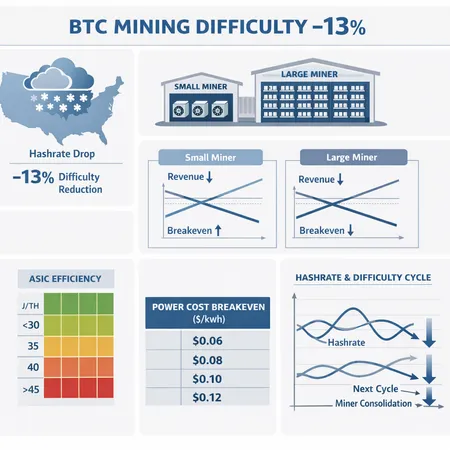
Executive summary
The network is set to ease mining difficulty by about 13% after a hashrate interruption caused by a US snow storm. That reduction immediately increases revenue per unit of hashing power for miners who stayed online by roughly 1 / 0.87 ≈ 1.15x (≈15%), because each hash now buys a larger share of block production until the next adjustment. For operators and institutional investors this is a temporary windfall that should be stress-tested against power cost, ASIC efficiency (W/TH), and the probability that idled rigs return — which will push difficulty back up.
This deep-dive shows: (a) the mechanics behind the decline; (b) a P&L framework for small vs. large miners; (c) how to model ASIC efficiency and power-cost sensitivity after the drop; and (d) implications for future difficulty cycles and consolidation. For background reporting on the difficulty move see the primary coverage at Bitcoinist and a mining-profitability primer at Cryptonomist. Also note: operators using services like Bitlet.app will want to update their cash-flow stress tests immediately.
Why the difficulty fall happened (mechanics and the snow-storm trigger)
Bitcoin difficulty is adjusted every 2016 blocks to target a 10-minute average block time. That algorithm is blind to cause: it responds to measured block-time deviations. A sudden, regional hashrate outage — in this case driven by a US snow storm that knocked out significant miner capacity — increased block times for a stretch, so the adjustment algorithm reduced difficulty by ~13% to restore the 10-minute cadence.
Put simply: if a fraction of global hashpower drops offline, remaining miners find a higher fraction of blocks until difficulty resets. The report documenting the ~13% ease and its connection to the storm is available here. That reduction is not a fundamental change in miner economics by itself; it is a timing shift that redistributes reward per hash across the short window between blocks and the next adjustment.
Short technical note on proportionality
Difficulty and network hashrate map roughly one-to-one when measured over an adjustment window: a X% fall in estimated hashrate historically produces approximately an X% drop in difficulty at the next adjustment (capped by limits in the protocol). Thus, a reported ~13% difficulty ease indicates the network observed about a 13% lower effective hashrate during the prior interval.
Immediate revenue and breakeven changes: small vs. large miners
The headline: revenue-per-hash increases roughly by the reciprocal of the new difficulty fraction (1 / 0.87 ≈ 1.149), so ~14.9% uplift. But the practical P&L effect is heterogeneous.
- Large miners: benefit more in cash terms because they control more hash; they typically negotiated lower electricity rates, run newer ASICs (higher efficiency), and can flex rigs (shut older ones or mine other chains). A 15% revenue bump shortens payback for efficient rigs and improves free cash flow, particularly for miners paying sub-$0.03/kWh.
- Small/minimum-scale miners: many run older, less efficient units and pay retail electricity rates (>$0.05–0.12/kWh); the same revenue uplift might be insufficient to push them into sustained profitability if their breakeven is materially higher.
Instead of storytelling, use a P&L model to compare.
Revenue and cost model (core formulas)
Use these building blocks to evaluate any fleet:
- Blocks per day ≈ 144 (nominal)
- Block subsidy (current) = S_BTC BTC per block (use S_BTC = 3.125 BTC after the 2024 halving; add average fees if you want gross revenue)
- Miner daily revenue (USD): Revenue_day = (H_miner / H_network) * Blocks_per_day * S_BTC * BTC_price
- Miner daily energy consumption (kWh): Energy_day = H_miner (TH/s) * Eff (W/TH) * 24 / 1000
- Daily electricity cost (USD): Cost_day = Energy_day * Electricity_price ($/kWh)
- Daily gross margin (USD): Gross_day = Revenue_day - Cost_day
Where: H_miner is the miner's hashpower in TH/s and H_network is network hash in TH/s.
Worked example (illustrative)
Assumptions (sample numbers for clarity; replace with live values):
- BTC_price = $40,000
- S_BTC = 3.125 BTC
- Blocks/day = 144
- H_network = X TH/s (leave symbolic) — we'll look at relative moves
Compute revenue per TH/day (USD):
Revenue_per_TH_day = (1 TH / H_network) * 144 * 3.125 * BTC_price = (450 * BTC_price) / H_network
If difficulty falls 13%, H_network inferred by difficulty drops by 13% in the adjustment window (or equivalently the revenue_per_TH increases by ~15%). So if revenue_per_TH_day was $R before, after adjustment it becomes ~1.149*R.
Energy cost examples: choose three ASIC classes (efficiency in W/TH):
- Modern top-tier: 21.5 W/TH (e.g., latest-gen machines)
- Mid-generation: 35 W/TH
- Old-generation: 95 W/TH
At 21.5 W/TH, energy/day per TH = 21.5 * 24 / 1000 = 0.516 kWh/day per TH. At 95 W/TH, energy/day per TH = 2.28 kWh/day per TH.
If retail electricity = $0.10/kWh, daily electricity cost per TH:
- 21.5 W/TH: 0.516 * 0.10 = $0.0516/day/TH
- 95 W/TH: 2.28 * 0.10 = $0.228/day/TH
So a 15% revenue uplift per TH dramatically improves profitability for the 21.5 W/TH rigs (where energy is a small fraction of revenue), but is only a modest help for 95 W/TH machines where energy dominates costs.
Breakeven electricity and BTC price (inverted forms)
Two common questions: given BTC price, what's the maximum electricity rate that yields non-negative margin for a machine? Or given electricity price, what's the minimum BTC price to break even?
Breakeven electricity ($/kWh): Elec_break = Revenue_per_TH_day / (Energy_day_per_TH) Rearranged: Elec_break = Revenue_per_TH_day / (Eff * 24 / 1000)
Breakeven BTC price for a machine at known electricity: solve Revenue_per_TH_day = Cost_day BTC_break = (Energy_day_per_TH * Elec_price) * H_network / (144 * S_BTC)
Because Revenue_per_TH_day scales linearly with BTC_price and inversely with H_network, the imminent 13% difficulty drop reduces H_network (as measured by difficulty) and therefore increases Revenue_per_TH_day, lowering Elec_break or BTC_break proportionally until the next adjustment.
Modeling ASIC efficiency and power-cost sensitivity after the drop
For technical investors, sensitivity tables and Monte Carlo scenario runs are useful. Key axes: BTC price, electricity $/kWh, fleet efficiency (W/TH), and assumed fraction of offline rigs that return.
Step-by-step modeling approach
- Use baseline network hashrate derived from recent difficulty (convert difficulty to TH/s) and apply the -13% adjustment to produce the new difficulty-implied hashrate for immediate revenue calculations.
- Compute Revenue_per_TH_day before and after adjustment (use S_BTC and realistic fee assumptions). The ratio gives the short-term uplift.
- For each ASIC class in the fleet, compute Energy_day_per_TH and Cost_day_per_TH for a set of electricity prices (e.g., $0.03, $0.05, $0.08, $0.12).
- Compute Gross_day_per_TH = Revenue_per_TH_day - Cost_day_per_TH and annualize to get Gross_yr_per_TH.
- For capex decisions, compute payback = Capex_per_TH / (Gross_yr_per_TH). Capex_per_TH = Unit_price / Unit_TH for the model rig.
- Run scenarios where a percentage P of the idled hashrate returns within 1–4 weeks — this will increase H_network and reverse some or all of the revenue uplift. Because the difficulty adjustment happens every 2016 blocks, the timing of return matters: if idled hash returns before many blocks are mined, the temporary uplift will be shorter.
Example sensitivity result (stylized)
- Efficient rig (21.5 W/TH), Elec = $0.035/kWh: daily cost per TH ≈ $0.018. If Revenue_per_TH_day before adjustment = $0.20, after adjustment ≈ $0.23. Gross increases from $0.182 to $0.212/day — an ~16.5% gross uplift.
- Old rig (95 W/TH), Elec = $0.08/kWh: daily cost per TH ≈ $0.182. If Revenue_per_TH_day before = $0.20, gross goes from $0.018/day to $0.048/day — percentage uplift is large but absolute margin remains thin and payback periods are long.
These stylized numbers show why efficient fleets scale faster in a turbulence event: their fixed energy overhead per TH is lower, so a revenue shock flows more directly to EBITDA.
Implications for next difficulty cycles and miner consolidation
The short answer: this event accentuates existing structural advantages and will likely accelerate consolidation pressure on high-cost, small-scale miners unless they have access to low-cost power or can redeploy rigs.
- If idled rigs come back online quickly, network hashrate will rebound and difficulty will rise, erasing the temporary uplift. That matters especially for miners who purchased rigs at elevated prices and rely on short payback windows.
- Large miners can choose to reallocate rigs, bid on surplus power contracts, or mine opportunistically (switch to pools or chains) to optimize margin. They also have negotiating power to lock-in lower power rates when demand for electricity dips.
- Small miners facing thin pre-shock margins may be forced to turn rigs off permanently or sell hardware. Secondary markets for used ASICs tend to depress prices, benefiting larger buyers who can pick up accreted hash cheaply — a consolidation vector.
Capex timing and institutional investor takeaways
- For new capex: a one-off difficulty dip is not a fundamental change in the long-run hash curve. Institutional investors should stress-test payback assuming difficulty rebounds (partial or full) within 1–3 months and run downside BTC-price scenarios. If your model’s IRR depends on temporary eases, re-evaluate timing.
- For opportunistic buys: used-ASIC markets will likely see supply (forced sellers) and price pressure if many small miners quit — that can create acquisition opportunities for scale players who value immediate hash over new warranty status.
- For debt and working capital: lenders should incorporate scenario stress that includes both the temporary uplift and the rapid reversal; covenant testing based on short-term uplift is risky.
Practical checklist for operators and investors (actionable next steps)
- Re-run fleet cash-flow models with updated difficulty and a 0–100% return-to-service scenario for idled rigs over 7–30 days.
- Compute electricity breakeven curves across your rig mix using the formulas above; prioritize shutting off or selling rigs whose breakeven is well above contracted electricity rates.
- For miners with convertible fleet composition, run payback timing both with and without the temporary uplift to see whether capex extends payback beyond acceptable thresholds.
- Monitor pool hashrate and co-locate data (regional outages) closely — the speed at which offline hash returns matters more than the magnitude for short-term revenue.
Strategic conclusion
This ~13% difficulty drop is a classic example of how exogenous, regional events ripple through protocol-level economics. The immediate effect is a meaningful, but temporary, boost in revenue-per-hash that favors efficient, low-cost operators while increasing stress on older or higher-cost fleets. For institutional investors and operators, the right response is careful modeling, not reflexive capex: extract the short-term margin where prudent, but assume that most of the uplift will be eroded as idled hash returns or as miners re-price risk and expand elsewhere. Use this window to buy low-cost hash only if your models assume persistent margin; otherwise, prioritize liquidity and selective purchases in the used-ASIC market.
For further reading on the news around the difficulty move see the Bitcoinist report and for a refresher on mining economics since Satoshi consult the Cryptonomist primer. Also consider integrating updated scenario outputs into tools such as Bitlet.app when modeling installment-style purchases or fleet financing.
Sources
- Bitcoinist — report on the ~13% difficulty ease: https://bitcoinist.com/bitcoin-miners-major-relief-13-difficulty-ease/
- Cryptonomist — primer on bitcoin mining profitability: https://en.cryptonomist.ch/2026/02/07/is-bitcoin-mining-profitable/
Additionally referenced internally: Bitcoin


