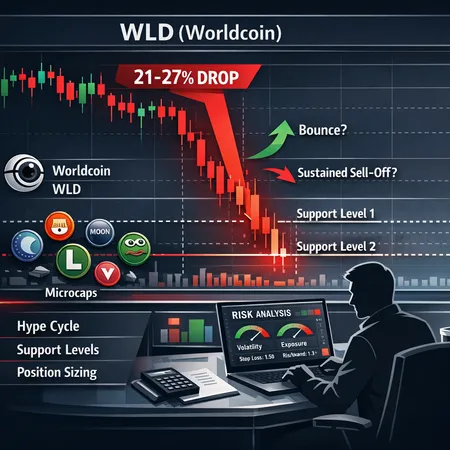
Worldcoin’s 21–27% Plunge: Technical levels, scenarios, and how to size risk in hype-driven microcaps
Summary
Quick context: what happened to Worldcoin (WLD)
Worldcoin’s token moved from speculative euphoria tied to OpenAI‑adjacent headlines into a sharp unwind: outlets reported declines in the low‑to‑mid‑20% range as the narrative faded and broader risk appetite cooled. BeInCrypto summarized a roughly 21% plunge after a failed recovery attempt, while analysis framing a deeper 27% correction tied the drop to evaporating OpenAI hype and a larger microcap re‑rating (BeInCrypto; CoinPaper).
That price action looks very familiar: fast run, headline‑driven rotation, then a sharp retracement as traders hunt for liquidity and early momentum expires. For many speculative traders this is not just WLD — it’s a template for how biometric token projects and other risk‑on microcaps behave in a hype cycle.
Technical support: how to map WLD’s levels without crystal balls
Instead of anchoring on a single price number (which changes by the hour), use layered, objective support markers to make trade decisions:
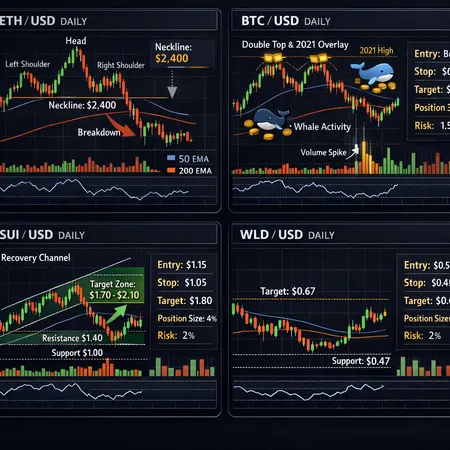
Fib retracements of the hype leg: draw the 0–100% on the run that preceded the crash. The 38.2% and 61.8% levels are often the first and second meaningful tests for a bounce. If WLD holds the 38.2% quickly and with expanding volume, a tactical re‑entry can be considered.
Volume‑by‑price / liquidity pockets: where did the most trading cluster during the rally? Those nodes often act as support because limit orders and stop liquidity accumulate there. A break below a heavy volume node signals a higher chance of follow‑through.
Moving averages and momentum bands: short‑to‑mid moving averages (e.g., 20–50 EMA) will usually be breached during rapid hype unwinds; the 200‑day MA is a slower filter and, if price is still above it, some structural support remains.
Round numbers and listing floor: psychological levels (round numbers, the listing price or pre‑hype range) often attract buyers and stops. Treat these as watch zones, not guarantees.
Concretely: treat the first support as the 38% fib plus any nearby high‑volume node; the secondary support is the 61.8% fib and the prior accumulation zone. If both fail with rising sell volume, you're likely in a sustained sell‑off.
Scenario analysis: bounce vs sustained sell‑off
Scenario A — Controlled bounce
- Price finds support at the 38% fib/high volume node.
- On‑chain and DEX liquidity show buyers stepping in (increasing taker bid volume), and daily volume is flat or rising on green candles.
- Newsflow remains neutral or brings clarifying updates (team statements, partnership confirmations).
If these conditions appear, a small, size‑controlled re‑entry can be justified. The tactical plan: partial position, tight stop just below the support, and scale out into strength. This path often results in a relief rally as price retests the prior short‑term highs.
Scenario B — Sustained sell‑off / capitulation
- Price breaks the 61.8% fib and key volume nodes with above‑average sell volume.
- Liquidity on DEX orderbooks thins and token concentration (large wallets) begins to dump.
- Social sentiment turns strongly negative and no constructive on‑chain metrics (active addresses, transfers) back the token.
This setup tends to produce multi‑leg declines and forces re‑evaluations of token fundamentals and runway. If WLD hits fresh weekly lows with widening spread and no meaningful buybacks, prepare for lower targets and a possible reclassification from “volatile meme/hype token” to “speculative microcap in distress.”
Position sizing: lessons for hype‑driven tokens
Trading tokens like WLD requires discipline more than intuition. Use these practical rules:
Cap exposure per trade and per theme: limit any single hype token to a small percentage of risk capital (e.g., 0.5–2% of portfolio) and enforce a tighter aggregate cap on the entire theme (biometric/hype tokens).
Volatility‑adjusted sizing: use ATR or realized vol to size positions. Higher expected move → smaller position. This keeps dollar risk within your plan even when % swings are extreme.
Predefine stop and scale rules: decide entry, stop, and scaling points before you trade. For example, enter 50% of intended size at confirmed support, add the remainder only on a validated bounce (higher highs on the rebound).
Use position life‑cycle thinking: treat these as event trades — they age quickly. Decide in advance whether you are intraday, swing, or multi‑month holder and plan exits accordingly.
Account for slippage and fees: microcaps often have poor liquidity. Estimate worst‑case slippage when sizing so a stop doesn’t become catastrophic.
These rules reduce the common behavioural errors that turn a few bad WLD‑like trades into portfolio damage.
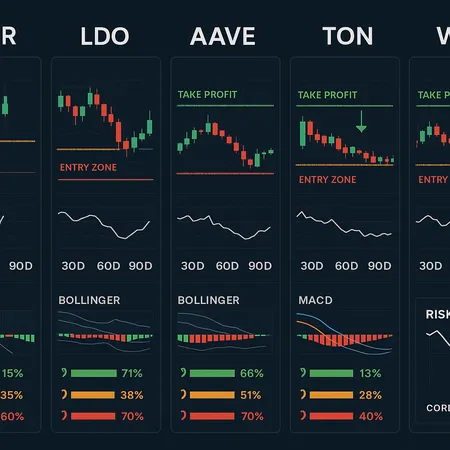
Spotting resilient microcaps when stress hits
Not all small caps behave the same when the market turns. To separate durable projects from pure hype pumps, screen for these indicators:
Orderbook / DEX liquidity depth: look beyond social hype. Does the token have substantive liquidity across pools or orderbook depth on central venues? Thin liquidity amplifies crashes.
Supply distribution: low concentration of tokens in a few wallets reduces the risk of whale dumps. Check vesting schedules and treasury lockups.
On‑chain activity and utility: sustained active addresses, meaningful transfer volume, and real use cases (even limited) matter more than Twitter volume. For smart contract tokens, consistent contract interactions and developer commits indicate ongoing product momentum.
Verified audits and transparent roadmaps: code audits, multisig treasury custody, and clear public milestones reduce tail‑risk compared with anonymous whitepaper projects.
Partnerships with operational follow‑through: partnership headlines followed by deliverables (integrations, product releases) are more durable than PR alone.
Crypto.news recently noted certain microcaps surged while BTC/ETH/SOL treaded water, highlighting how rotation into small caps is common when majors pause — but that rotation favors quality microcaps with real liquidity and activity (Crypto.news).
Tactical checklist for a WLD trade setup
- Draw the Fib retracements from the hype low to high and mark 38% / 61.8% levels.
- Identify high volume nodes on VbP and note the nearest moving averages.
- Confirm on‑chain metrics: active addresses and transfer count for the past 7–30 days.
- Check liquidity concentration and recent whale activity.
- Size the position by ATR and cap exposure; set a hard stop and a scale plan.
- Monitor the pattern: expansion in buy volume on rallies or widening sell volume on breakdowns.
Use Bitlet.app for keeping track of allocations if you manage multiple high‑volatility positions, but avoid treating any tool as a substitute for the rules above.
Bottom line
WLD’s 21–27% correction after OpenAI hype faded is an archetypal reminder that narrative‑driven microcaps can swing violently when headlines stop supporting price. Traders who survive these cycles are the ones who map objective support levels, size positions by realized volatility, and preferentially allocate capital to microcaps with genuine liquidity and on‑chain activity. Treat trades in biometric or hype tokens as event‑driven plays with strict risk limits — the runway for a bounce is always shorter than the runway for a breakdown.
Sources
- Worldcoin WLD price crashes — BeInCrypto
- Worldcoin price prediction after 27% crash — CoinPaper
- Microcaps surging while majors tread water — Crypto.news
For context on market bellwethers, remember that many traders still watch Bitcoin for risk sentiment cues, and you can find ongoing commentary about token narratives on the Worldcoin tag.