Mid-Cap Altcoin Roundup: Price Predictions for HBAR, LDO, AAVE, TON, WLD
Summary
Executive summary
Mid-cap altcoins often offer asymmetric return potential compared with large caps—but they also carry higher correlation to Bitcoin and sensitivity to macro risk-off. In this roundup I synthesize recent technical forecasts for HBAR, LDO, AAVE, TON, and WLD, explain the why behind each projection (RSI, Bollinger Bands, MACD), assign probability-weighted timelines, and give concrete trade setups and stop-loss sketches. For many traders, HBAR remains a textbook oversold-reversal candidate; for others, AAVE’s structure suggests a higher-conviction bounce if BTC stabilizes. This is practical, timeframe-driven guidance for swing traders and retail altcoin investors—contextualized to how macro risk-off and BTC declines shape recovery windows.
Macro context: BTC correlation and risk-off dynamics
When Bitcoin sells off, capital tends to flow out of riskier mid-cap tokens first. Historically, altcoins amplify BTC moves: a 10% BTC fall can mean 15–40% drawdowns in mid-caps depending on liquidity and narrative strength. During macro-driven risk-off (rising yields, USD strength, equity weakness), traders chase liquidity and reduce exposure to speculative assets—altcoins typically underperform until volatility subsides.
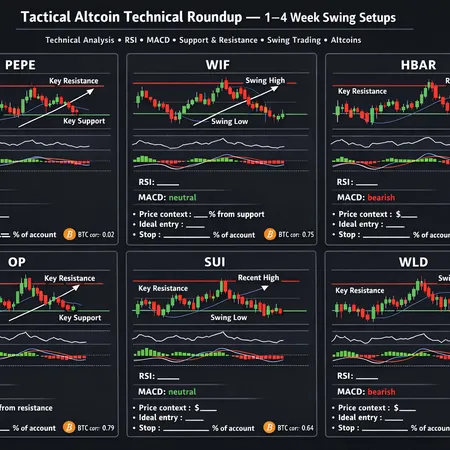
Technically, that means you’ll often see oversold RSI readings across alt-coins at the same time, tighter Bollinger Bands as volatility compresses, and mixed MACD signals (frequent false crossovers). Any recovery is therefore a two-step process: (1) BTC stabilization/rotation into risk assets, and (2) individual token technical cleanup and volume confirmation. Note: users who use platforms like Bitlet.app for installment or P2P flows should treat these setups as conditional on broader market calm.
Coin-by-coin breakdown, indicators, probabilities and trade setups
HBAR — recovery target $0.22–$0.25 (oversold support)
Technical picture: Recent forecasts point to a recovery area around $0.22–$0.25, driven by an oversold RSI and support near the lower Bollinger Band acting as a mean-reversion floor. The MACD is currently neutral-to-bearish but flattening, which implies a bounce is plausible once momentum turns positive. See the detailed note predicting HBAR’s bounce here: HBAR recovery outlook.
Probability-weighted timeline:
- 0–4 weeks: 35% chance of an initial snap bounce into $0.18–$0.20 (short squeeze/mean reversion)
- 4–12 weeks: 50% chance to reach $0.22–$0.25 if BTC stabilizes and volume picks up
- 3+ months: 15% chance of sustained break above $0.27 without broad market improvement
Trade setup and stop-loss sketch: Consider a staggered long between $0.16–$0.19 (scale-in). Target 1: $0.22 (take partial profits), Target 2: $0.25. Stop-loss: below $0.14 (10–12% below entry band) or tighten to breakeven once 50% of position is profitable. Use position sizing that limits portfolio risk to 1–2% on the full position.
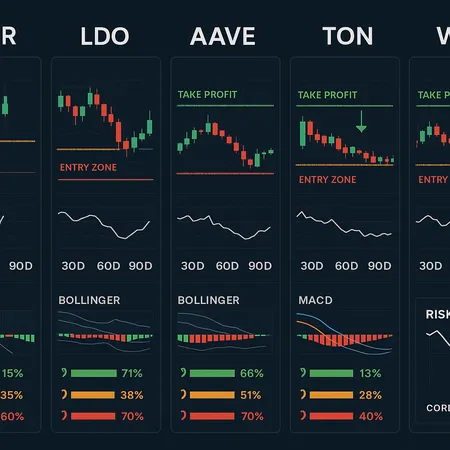
LDO — target $0.82–$0.96 (bullish divergence forming)
Technical picture: LDO has shown early bullish divergence on RSI and easing downward pressure on Bollinger Bands; the short-term MACD is forming a positive histogram readout in some scenarios. Technical forecasts point to a $0.82–$0.96 recovery window if the divergence confirms and buyer volume returns: LDO forecast and divergence.
Probability-weighted timeline:
- 0–4 weeks: 25% chance of a clean breakout to $0.75 if BTC posts a relief rally
- 4–12 weeks: 55% chance of target range $0.82–$0.96 as divergence matures
- 3+ months: 20% chance of extended recovery >$1.00 if market liquidity improves
Trade setup and stop-loss sketch: Entry zone $0.62–$0.70 on consolidation and RSI improvement; partial profit at $0.82, larger trim at $0.96. Stop-loss: below $0.58 (8–10% risk) with a trailing stop once price breaches $0.82. Because LDO often trades with elevated volatility, tighten size accordingly.
AAVE — potential near-term target $208 despite bearish MACD
Technical picture: AAVE is interesting: some models still see upside toward $208 even though the MACD reads bearish and the RSI is deeply oversold—this structure favors rebound trades once selling momentum eases. The short-term forecast arguing for a $208 recovery discusses how oversold conditions can create sharp mean-reversion rallies: AAVE recovery note.
Probability-weighted timeline:
- 0–4 weeks: 30% chance of a sharp mean-reversion to $150–$170 if BTC posts a relief bounce
- 4–12 weeks: 45% chance to test $190–$208 assuming decreasing selling pressure and improved DeFi flows
- 3+ months: 25% chance of sustained move >$208 if DeFi demand recovers materially
Trade setup and stop-loss sketch: Swing entry between $100–$125 for higher reward-to-risk, or conservative entry between $130–$150 for lower variance. Targets: partial at $170, full at $208. Stop-loss: below $95 (10–15% downside tolerance for aggressive entries). Consider correlation with broader DeFi token performance; reduce size if DeFi metrics remain weak.
TON — target $2.50–$2.70 with critical support at $1.75
Technical picture: TON’s outlook projects a 37–48% upside to $2.50–$2.70 with critical support at $1.75. RSI is near support-zone lows while Bollinger Bands show compressed volatility—this sets up either a range-bound consolidation near $1.75 or a bounce to the forecast range if BTC accepts risk again. Read the technical context here: TON price outlook.
Probability-weighted timeline:
- 0–4 weeks: 30% chance of a relief bounce to $1.95–$2.15
- 4–12 weeks: 50% chance of a run to $2.50–$2.70 if BTC steadies and on-chain flows increase
- 3+ months: 20% chance of extended upside beyond $3.00 if fundamentals and network activity pick up
Trade setup and stop-loss sketch: Enter in tranches across $1.75–$1.95 with an initial target band $2.50–$2.70. Protect position with a stop-loss below $1.60 (8–10% risk per tranche). Because TON can be liquidity-sensitive, prefer limit entries and scale size to account for slippage.
WLD (Worldcoin) — rebound target $0.84 on oversold RSI
Technical picture: Recent analysis suggests WLD could rebound toward $0.84 as RSI turns oversold at critical support; Bollinger Bands suggest there’s room for a mean-reversion move if selling pressure exhausts. The forecast that points to a $0.84 recovery ties directly to oversold momentum indicators: WLD rebound view.
Probability-weighted timeline:
- 0–4 weeks: 40% chance of a quick bounce to $0.60–$0.70 on short covering
- 4–12 weeks: 45% chance to reach $0.84 if market sentiment improves
- 3+ months: 15% chance of exceeding $1.00 only in a broad risk-on return
Trade setup and stop-loss sketch: Consider a smaller, tactical entry between $0.45–$0.55 for a quick scalp to $0.70–$0.84. Stop-loss: below $0.42 (8–12% risk). Given Worldcoin’s narrative sensitivity, use smaller position sizes than for more liquid mid-caps.
Cross-asset correlation and execution notes
Correlation to BTC: These mid-caps are highly correlated to BTC's direction in the short term. A BTC stabilization or 5–10% relief rally materially improves the probability weights above. Conversely, renewed BTC weakness will likely invalidate near-term recovery probabilities—watch BTC's 20–50 DMA and volume for conviction.
Indicator stacking: The best setups combine an oversold RSI reversal, price hugging the lower Bollinger Band with a widening band on volume expansion, and a MACD histogram turning positive. If only one indicator lines up (e.g., RSI oversold but MACD strongly bearish), treat the setup as lower conviction and scale position sizing accordingly.
Macro risk-off: In a rising-rate or USD-strength environment, expect range-bound behavior and slower recoveries. Altcoin recoveries often lag BTC by 1–4 weeks in such regimes; prioritize trades with clear stop-loss levels and smaller sizing.
Prioritized trade ideas (ranked) and risk-management checklist
- HBAR (medium conviction): Clear oversold structure and tight recovery window; scale-in on $0.16–$0.19. Keep tight stops and take partial profits at $0.22.
- TON (medium-high conviction): Good risk/reward at support $1.75 with defined target band $2.50–$2.70.
- LDO (medium conviction): Bullish divergence but higher volatility—use staggered entries and smaller size.
- AAVE (opportunistic): High payoff if DeFi flows return, but watch bearish MACD; use conservative entries.
- WLD (tactical scalp): Narrative-driven and volatility-sensitive—smaller positions for short-term bounces.
Risk-management checklist:
- Limit any single trade to 1–3% of portfolio risk.
- Use stop-losses based on technical invalidation, not fixed dollar amounts.
- Scale in to reduce tail risk; prefer limit orders in low-liquidity environments.
- Monitor BTC and macro headlines—altcoin setups are conditional on broader market calm.
Methodology and closing notes
This roundup synthesizes recent technical forecasts and translates them into practical, probability-weighted timelines and trade sketches using standard indicators: RSI, Bollinger Bands, and MACD. I cited the latest technical pieces for each token to ground the view and compared indicator stacks across the group. For traders, the key is to treat each setup as conditional on BTC behavior and macro risk appetite; the same indicator signal means different things depending on whether BTC is stabilizing or breaking down.
Technical analysis is probabilistic, not certain. The timeline probabilities above reflect current on-chain and technical context and will shift as volatility, volume, and macro variables change. If you want a tighter watchlist for active swing management or a customizable trade-sizing matrix, combine these setups with your risk-tolerance rules and consider using a platform that supports staged entries and exit automation. Good risk controls and clear stop rules matter more than picking the perfect bottom.