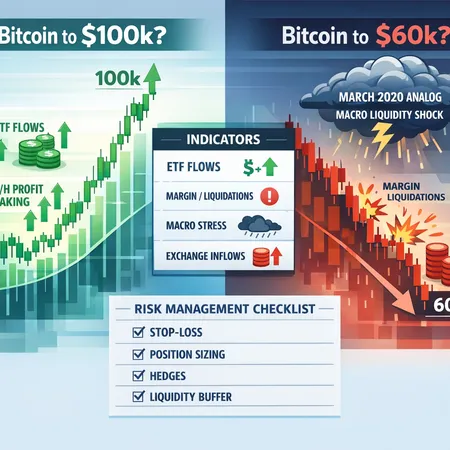
Bitcoin Price: Balancing the $100K Momentum Story with Credible Crash Scenarios
Summary
Why this debate matters
Bitcoin’s next major move is not just a price story — it’s a risk-management problem. For intermediate traders and risk managers, framing both the bullish momentum toward $100K and the plausible crash scenarios into measurable indicators is the difference between a disciplined trade and an avoidable drawdown. This article contrasts the narratives, points to the on-chain and macro signals that validate each path, and finishes with a practical checklist you can use in live markets.
For many traders, Bitcoin still functions as the market bellwether: spot flow, ETF demand, and concentrated holder behavior often set the tone for broader crypto risk appetite. But narratives can diverge quickly — momentum begets more momentum until it doesn’t — so you need a plan that works both on the run and in a tail event.
The bullish case: momentum, ETFs, and short-term holder dynamics
Bull case proponents point to a confluence of technical momentum, improving liquidity products, and behavioral supply constraints. A recent bullish narrative frames renewed momentum toward $100K as driven by continued inflows and short-term holder positioning: when short-term holders hold rather than sell, realized supply tightening can amplify rallies (NewsBTC analysis).
Key mechanics that support the upside:
- ETF flows and institutional buying: persistent positive net flows into spot-like BTC ETFs create a steady bid beneath price and reduce available float. Monitor daily and weekly ETF flow reports; positive, sustained inflows are a clear bullish validation.
- Short-term holder exhaustion: when short-term holders (STHs) stop offloading coins at higher prices — or begin accumulating — selling pressure eases. On-chain metrics like STH realized cap and mean coin age can reveal this shift.
- Technical momentum and positive macro correlation: in a benign macro environment, BTC can decouple from short-term risk-off moves and resume trend-following rallies as leverage is paid down and risk appetite returns.
If these elements align — steady ETF inflows, minimal exchange inflows, declining short-term holder sales — the path to $100K becomes much more probable in a momentum-driven market.
The bearish case: expert crash calls and macro liquidity shocks
The counterargument is sober: momentum can reverse suddenly, and some credible market participants warn of a meaningful correction. A trading expert recently outlined a potential crash to around $60K later in the year based on valuation and cyclical signals (Finbold coverage). That kind of scenario is not fantasy — it’s a plausible mean-reversion if leverage and liquidity conditions deteriorate.
Even more concerning is the macro tail-risk: macro strategists have flagged the possibility of a March-2020-style liquidity event that produces broad, rapid de-risking across asset classes, including BTC (Bitcoin.com coverage of Luke Gromen's warning). In such an event, correlations spike toward 1, margin calls trigger forced sales, and even long-term holders can capitulate under extreme stress.
Bear-case drivers include:
- Sudden ETF outflows or redemptions that flip demand to supply.
- Large exchange inflows and concentrated selling from whales or funds facing redemptions.
- Rising margin and concentrated long positions that produce cascade liquidations once price breaks key levels.
- A macro liquidity shock that forces broad deleveraging across risk assets.
These dynamics can amplify each other: a macro liquidity squeeze increases correlations, ETF flows can reverse, and forced selling can overwhelm natural buyers.
Indicators that validate either scenario
Below are the concrete signals to monitor. Think of them as either/or validation: several of these moving in the bullish direction increases the odds of continued upside; several in the bearish direction increase crash probability.
ETF flows (daily & weekly)
Why it matters: spot ETF inflows represent direct demand for BTC. Sustained positive flows are a structural bid; abrupt outflows remove that support.
How to monitor: follow ETF flow trackers and filings. Watch net flows, not just headline inflows — increasing redemptions or net-zero flow weeks after a rally are warning signs.
Bull validation: multi-week positive net inflows. Bear validation: rapid, large redemptions or a shift to net outflows.
Exchange inflows and accumulation/decumulation patterns
Why it matters: inflows to exchanges increase sell pressure potential. Persistent accumulation off-exchange (cold wallets) reduces available float.
How to monitor: on-chain exchange inflow charts and large wallet movement alerts.
Bull validation: declining exchange inflows, rising long-term holder accumulation. Bear validation: sudden large exchange inflows concentrated in a short window.
Margin, open interest, and liquidation risk
Why it matters: the more leverage in the system, the larger the potential cascade when price moves against the crowded trade.
How to monitor: derivatives open interest, funding rates, and concentrated long/short ratios on major venues.
Bull validation: low funding stress, falling open interest as traders de-risk on small pullbacks. Bear validation: high leverage, elevated long funding, and rising concentrated open interest.
On-chain holder behavior (STH vs LTH)
Why it matters: whether short-term holders (STHs) are taking profits or accumulating directly impacts immediate supply available to the market.
How to monitor: STH realized cap, coin days destroyed, and mean age metrics.
Bull validation: STH accumulation or low-profit-taking; Bear validation: STH spike in selling following price run-ups.
Macro liquidity and correlation indicators
Why it matters: a systemic liquidity shock (credit stress, banking runs, or sudden policy shifts) can force simultaneous selling across assets.
How to monitor: risk-free yields, credit spreads, FX stress indicators, and cross-asset correlation metrics. Stay current with macro commentary — warnings like those from macro strategists are not to be ignored (Luke Gromen's warning).
Bull validation: stable or easing credit spreads, low cross-asset stress. Bear validation: widening credit spreads, sudden liquidity drains, collapsing interbank funding.
A practical risk-management checklist for intermediate traders and risk teams
Below is a compact checklist you can implement quickly. Treat it as a living playbook: update sizes and thresholds to your capital base and mandate.
Position sizing and trailing stops
- Limit any single BTC position to a defined percent of risk capital (e.g., 2–5%).
- Use trailing stops for trend trades but widen them in volatile regimes to avoid being shaken out by noise.
Leverage rules
- Cap leverage exposure; prefer spot or low-leverage structures when macro uncertainty is elevated.
- Reduce or eliminate directional leverage when funding rates are extreme or open interest spikes.
Diversify execution venues
- Split liquidity across venues to avoid single-exchange counterparty or flow risk. Watch on-chain exchange inflows to time exits if needed.
Watchlist with actionable triggers
- ETF flows: predefine a response to X consecutive days/weeks of net outflows (e.g., reduce exposure by Y%).
- Exchange inflows: set alerts for large, sudden inflows above a threshold (e.g., >0.5% of circulating supply uploaded in 24h across major exchanges) and prepare to hedge or reduce position.
- Leverage and funding: if funding rate > 0.05%/day or open interest increases >Z% in 72 hours, trim longs.
- Macro stress: predefine a cross-asset correlation trigger (e.g., risk-off index spike or credit spread widening by N bps) that mandates defensive rebalancing.
Hedging and liquid reserves
- Keep a portion of the portfolio in cash or stablecoins as dry powder for dislocations.
- Consider short-dated options or inverse products to hedge immediate tail risk if a macro shock is imminent.
Communication and governance
- For teams, ensure decision rules for rapid deleveraging are documented and executable without bureaucratic delay.
- Rehearse the plan: stress-test the checklist in simulated drawdown scenarios.
Putting it together: example scenarios and a simple rule set
Momentum wins (bull scenario): ETF flows remain net positive for 4+ weeks, exchange inflows fall, STHs stop selling. Rule: add incrementally to trend with tight risk controls, increase trailing stop to lock profits.
Tail event (bear scenario): credit spreads widen sharply, ETF redemptions occur, major exchange inflows spike. Rule: reduce gross exposure by at least 30–50%, move remaining exposure to hedges and liquid reserves.
Mixed signals: ETF inflows positive but leverage is extreme and a macro wobble appears. Rule: prioritize reducing leverage first; keep partial exposure funded by durable holders. Avoid all-or-nothing decisions.
Final notes: humility and preparation
Narratives will change — bullish momentum can accelerate quickly, and tail risks can emerge from unlikely corners. The goal is not to predict perfectly but to be prepared with observable triggers and a disciplined response. Keep monitoring ETF flows, exchange inflows, margin and liquidation metrics, and macro liquidity indicators; those five areas will give you the clearest early warning signals.
For execution and custody planning, many traders use modern platforms for dollar-cost-averaging, installment buys, or yield products — platforms like Bitlet.app are part of that ecosystem — but never let service convenience replace your risk rules.


