How Hyperliquid’s 1.2M HYPE Unlock and the $585M Year‑End Wave Could Reshape Short‑Term Liquidity
Summary
Executive summary
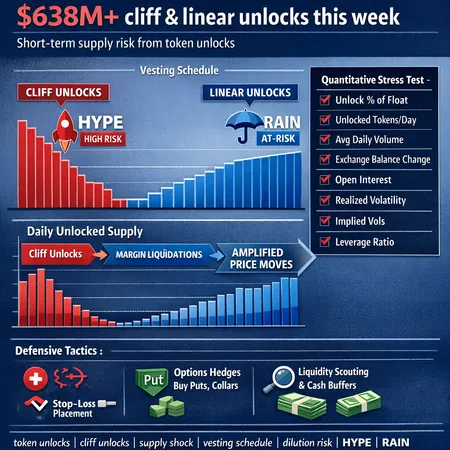
Late‑December to early‑January brought a concentrated set of scheduled token unlocks — headlined by Hyperliquid’s unlocked 1.2M HYPE tokens — that together represent about $585M in potential circulating supply when aggregated across several projects. For project teams and traders, the key questions are: how fast will tokens actually hit tradable liquidity, what net inflation remains after buybacks and burns, and how should teams communicate to avoid unnecessary sell pressure? This guide walks through Hyperliquid’s specifics, the broader unlock calendar, modeling techniques, and practical treasury and disclosure recommendations.
Why token unlocks matter now
Token unlocks are predictable supply shocks. But predictable does not mean benign: the timing, receiver (team, private investors, ecosystem), and subsequent treatment (sell, lock, burn, buyback) determine real‑world market impact. Traders should treat unlocks as catalysts that change available tradable float and can alter order‑book depth on short notice. Project PMs and treasury teams can blunt the effect by designing clear vesting mechanics and public commitments that reduce informational uncertainty.
Hyperliquid: the 1.2M HYPE unlock explained
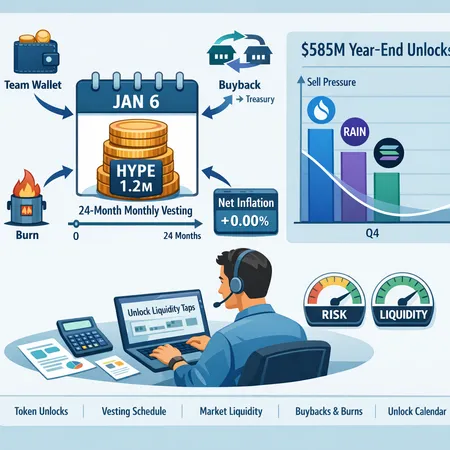
Hyperliquid announced the unstaking of 1.2 million HYPE to begin a team vesting schedule on January 6. The plan moves tokens from staking into a vesting pool and initiates a 24‑month monthly unlock cadence for team allocations, while also committing to buyback and burn activity intended to offset some newly unlocked supply.
Specific reporting from industry outlets notes that Hyperliquid will run the 24‑month schedule alongside buybacks and burn programs that are expected to meaningfully reduce net inflation over time Crypto.News and the initial announcement explained the vesting proportions and timing in more detail AMBCrypto. When you examine the mechanics, three practical items matter for market impact:
- The monthly cadence smooths out the flow relative to a single large cliff unlock, but still creates a recurring, predictable supply drip.
- Who receives the unlocked tokens (team wallets, treasury, or a vesting contract) shapes immediate sellability; tokens in time‑locked vesting contracts are less likely to be dumped immediately.
- Offset mechanisms — here, on‑chain or on‑market buybacks and burns — change net inflation and market perception more than the headline unlocked number.
Buybacks, burns and net inflation: the math you should run
Buybacks and burns are common tools to counteract supply inflation, but not all buybacks are equal. A buyback funded from protocol revenues that is executed transparently on market can remove float and support price. A promise of a future burn without a committed funding source is weaker. When assessing net inflation from an unlock, use this simple framework:
- Start with gross unlocked tokens per period (e.g., monthly unlocked HYPE = 1.2M / 24 = 50,000 HYPE/month).
- Subtract tokens expected to remain illiquid due to additional locks or multisig holding percentages (e.g., 20% of unlocked tokens go to time‑locked team wallets for another 6 months).
- Subtract tokens removed through committed buybacks and burns during the same period.
- Divide by current circulating supply to estimate percentage increase in float per period.
Example: if Hyperliquid releases 50,000 HYPE/month, 20% remains non‑tradable (10,000 HYPE), and the project commits to burn 15,000 HYPE/month via buybacks, net new tradable HYPE is 25,000 per month. If circulating supply is 10M HYPE, that’s a 0.25% increase in tradable float monthly — a small mechanical figure but not negligible for low‑liquidity markets.
Crypto.News reported that Hyperliquid plans to pair the vesting schedule with buybacks and burns; when you model the net effect, ask: is the burn sized to match or exceed the unlocked flow? If not, the supply headwind is real and persistent. AMBCrypto’s coverage captures the announcement and vesting outline that teams and traders should read to see exact ratios and triggers.
The wider $585M unlock cluster: SUI, RAIN, SOL and peers
Hyperliquid was not alone. Industry compilers put the cumulative scheduled unlocks at roughly $585M across several projects in the Dec. 29–Jan. 5 window, with notable entries such as SUI, RAIN and SOL leading the list Cryptopolitan. That clustering matters because overlaps can produce correlated liquidity draws: market makers rebalancing risk across tokens, and leveraged traders reacting to multiple simultaneous supply events.
When multiple large projects unlock within a short window:
- Order‑book depth is thin relative to the potential sell quantity in small‑cap pools, so price impact per sold token is higher.
- Liquidity providers may withdraw or widen spreads to avoid inventory risk.
- Cross‑correlated markets (for example, DeFi LP positions that include SOL) can experience second‑order effects; consider how an SOL sell‑off could compress liquidity in other pools where SOL pairs reside.
For context, traders who normally watch macro bellwethers like Bitcoin should add the unlock calendar as a shorter‑term risk overlay; similarly, DEX and DeFi LP managers must model the risk of impermanent loss magnified by concentrated unlocks.
How traders should model unlock‑related liquidity taps
Traders need simple, repeatable scenarios rather than perfect predictions. Build three scenarios for each unlock: conservative (low sell), baseline (expected sell), and stress (high sell). Each scenario should specify:
- Tokens released into tradable wallets per period.
- Expected percentage sold into market within period (e.g., 10%, 40%, 70%).
- Market depth metrics: average daily volume (ADV), top‑of‑book liquidity within target slippage bands (e.g., 0.5%, 1%).
A practical modeling step:
- Compute potential sell quantity = unlocked tradable tokens * assumed sell‑through rate.
- Compare sell quantity to typical daily volume and to liquidity within your slippage band. If expected sells exceed 10–20% of ADV or equal a large fraction of liquidity at 1% slippage, treat as a high‑impact event.
- Map outcomes to margin calls or liquidation scenarios for leveraged positions; hedge or reduce exposure ahead of the unlock if necessary.
Example: using the earlier Hyperliquid numbers, if 25,000 HYPE/month becomes tradable, and a baseline sell‑through is 40%, then ~10,000 HYPE could hit market in a month. If HYPE’s ADV is 20,000 HYPE, that’s 50% of daily volume concentrated in a shorter window — a meaningful execution risk that likely widens spreads and deepens slippage.
Treasury and disclosure best practices for projects
Transparency and pre‑committed, credible mechanisms are the best defenses against unnecessary sell pressure. Recommended practices:
- Publish a clear, machine‑readable unlock calendar on‑chain and on your site, and update it for any changes.
- Use monthly or more frequent cadence where possible; avoid large cliff unlocks without prior notice. Hyperliquid’s 24‑month monthly approach is preferable to a single cliff, though communication is key.
- Tie buybacks and burns to defined, verifiable revenue or reserve sources and publish execution proofs (on‑chain receipts, burn transactions).
- Consider phased market operations (e.g., limit‑order scheduled buybacks, OTC placements for large management trades) to reduce on‑book impact.
- Maintain a treasury liquidity buffer in stable or liquid assets to fulfill commitments without forced selloffs.
- Engage liquidity providers and market makers ahead of the unlock so they price inventory appropriately and maintain narrower spreads.
Good disclosure lowers fear. When markets are surprised, rumor and uncertainty create outsized selling. Commitments that are enforceable and observable — like on‑chain burns — carry the most market credibility.
Communication playbook: reduce signalling noise
The way information is presented matters. Practical guidelines:
- Publish technical details (amounts, dates, vesting contracts) and a plain‑language summary for non‑technical stakeholders.
- Explain the use of unlocked tokens (compensation, treasury, ecosystem growth) and provide a timeline for any on‑market operations.
- Avoid vague future language about “possible” burns. If the project intends to execute burns only after certain revenue thresholds, state those thresholds clearly.
- Coordinate timing of announcements with actual vesting transactions to avoid mismatched expectations and last‑minute volatility.
Action checklist for different stakeholders
- Project PMs/Treasury: Update the unlock calendar, commit to transparent buyback/burn funding sources, and engage LPs in advance. Consider staggering OTC sales and limit orders.
- Treasury managers: Model net inflation monthly, stress‑test balance sheet vs. extreme sell‑through scenarios, and maintain liquid reserves to meet commitments.
- Traders/PMs: Build conservative/baseline/stress scenarios; measure expected sell quantity vs. ADV and slippage bands; hedge or trim exposure ahead of concentrated unlock windows.
Mentioning operational tools: platforms that track unlock calendars and on‑chain flows can help automate monitoring; Bitlet.app is one of many ecosystem services traders use to follow short‑term catalysts.
Final takeaways
A headline number like “1.2M HYPE” or a $585M aggregate unlock grabs attention, but impact comes down to cadence, who gets the tokens, and what offset mechanisms are credibly in place. Hyperliquid’s 24‑month monthly vector plus buybacks and burns is a measured approach — useful, but not automatically neutralizing. Model the net tradable flow, compare it to liquidity metrics, and demand transparent, on‑chain proof for any buyback/burn claims.
When multiple unlocks cluster, treat the calendar as a cross‑asset liquidity event rather than a series of isolated token stories. With clear disclosure and sensible execution strategies, projects can minimize price disruption; without them, predictable unlocks become preventable market shocks.
Sources
- Hyperliquid unstake and vesting coverage: Crypto.News report on 1.2M HYPE unstake and buybacks
- Initial Hyperliquid team vesting announcement and details: AMBCrypto coverage of 1.2M HYPE unlock
- Broader scheduled unlock overview: Cryptopolitan roundup of $585M in year‑end token unlocks