Bitcoin Mining Economics 2025–26: Reconciling Bitmain Price Cuts, Rising Difficulty, and Miner Survival
Summary
Executive summary
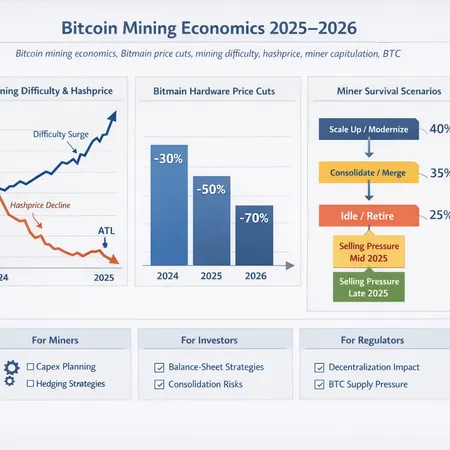
2025 has been a turning point for Bitcoin mining economics. On one hand manufacturers — most notably Bitmain — cut ASIC prices sharply to clear inventory and react to weak hashprice, offering discounts up to 60% on new rigs. On the other, the network’s mining difficulty climbed markedly (a reported ~35% net rise during 2025), which increases the hashing requirement to mine each BTC and compresses miner revenue per unit of hash. The result is a three-way dynamic: compressed revenues (hashprice pressure), cheaper entry and accelerated secondary-market depreciation, and a consolidation pressure that advantages large, low-cost operators.
For institutional analysts and mining operators planning capex and balance-sheet strategy, the immediate takeaway is this: lower sticker prices do not automatically translate to faster recovery — they can accelerate hardware churn and depress resale values just when difficulty is rising. The right response combines liquidity management, carefully staged capex, diversified power and revenue sources, disciplined hedging, and opportunistic M&A.
Market forces in 2025–2026: Bitmain cuts and difficulty spikes
Two published data points frame the macro shift. First, Bitmain publicly reduced prices across its lineup to move inventory amid weak demand — discounts were reported up to 60% on some models as the company prioritised sales over margin preservation to avoid stock piling older-gen inventory Blockonomi. Second, network conditions tightened: the Bitcoin mining difficulty experienced a net rise of roughly 35% across 2025, intensifying the compute requirement to mine block rewards and lowering expected daily issuance per TH/s for any given rig Bitcoinist.
At a glance these moves look contradictory — cheaper rigs should expand capacity while rising difficulty means every TH/s yields less BTC. The reconciliation is a market-clearing process: manufacturers cut prices to sell through inventory because weak hashprice (revenue per hash) made buyers cautious, while difficulty increases were driven by prior-capacity growth and continued deployments. In other words, supply of hash and supply of hardware are moving on different lags and through different actors (OEMs vs. operators), producing short-term stress.
How price cuts, difficulty and hashprice interact — a simple mechanics framework
Hashprice is the revenue earned per unit of hashing power (e.g., per TH/s) over time. It is directly influenced by BTC price, network difficulty/hashrate, block subsidy/fees, and the time horizon. When difficulty rises, hashprice falls all else equal. When hardware prices fall, the capital required to add TH/s falls, but expected ROI depends on future hashprice and resale value of hardware.
A practical way to think about miner economics is via an all-in cost model:
- Revenue per TH = (BTC price) × (BTC earned per TH over time given network difficulty)
- All-in cost per TH = electricity_cost + hosting/opex + depreciation/amortization of hardware + financing costs
- Profitability condition: Revenue per TH > All-in cost per TH
Example (illustrative): if electricity+hosting = $0.04/kWh and a rig consumes 30 kW per PH, then OPEX scales quickly; a 35% difficulty rise reduces daily BTC issuance per TH, meaning revenue per TH drops — even if the rig was purchased at a deep discount, the amortization schedule and resale value assumptions shift unfavorably.
Important second-order effects:
- New-hardware price cuts accelerate secondary-market depreciation: operators expecting to recoup partial capex through resale now face lower recovery values, compressing effective life and increasing amortization per reporting period.
- Cheaper OEM prices lower expansion capex for well-capitalized firms but can encourage opportunistic builds by marginal players, temporarily increasing network hashrate and driving further difficulty increases.
- Financing dynamics change: lenders reprice asset-backed loans when ASIC prices fall, raising haircuts and reducing leverage available to smaller miners.
Miner survival scenarios (flow chart + narrative)
Below is a practical flow chart mapping the typical paths an operator can take under compressive economics. Use this as a decision framework rather than a prescriptive map.
Start -> Assess All-in Cost vs Hashprice
    |
    +--> If All-in < Revenue (Healthy) -> Scale / Hold / Rebalance Capex
    |         |
    |         +--> Opportunistic expansion (if capital and PPA available)
    |
    +--> If All-in ≈ Revenue (Marginal) -> Triage: cut OPEX / renegotiate power
    |         |
    |         +--> Reprice assets; consider used-ASIC buys for refresh
    |
    +--> If All-in > Revenue (Under Stress) -> Two branches
              |
              +--> Consolidate: seek M&A, sell rigs, refinance debt
              |
              +--> Capitulate: liquidate BTC reserves, exit/repurpose assets

Outcome nodes:
- Scale: greater survivorship for low-cost operators
- Triage: survive if can lower opex or get cheap capex
- Consolidate: industry consolidates, fewer operators, higher centralization risk
- Capitulate: adds selling pressure to BTC market; increases used-ASIC supply
Narrative for each path:
Scale/Hold: Low-power-cost miners with long-term PPAs and low leverage can buy discounted rigs and expand profitably if they expect hashprice recovery. Lower OEM prices benefit these players by reducing marginal expansion capex and improving forward-looking IRR.
Triage: Operators near breakeven must aggressively reduce operating cost or renegotiate hosting and power contracts. They may selectively buy discounted rigs to replace inefficient fleet segments, but must model short resale values.
Consolidate: Mid-size operators facing tighter credit will become M&A targets. Buyers will value assets at distressed-equipment pricing; sellers may accept equity in return for balance-sheet relief. This process concentrates production in fewer hands and brings capital markets into mining faster.
Capitulate: When cash runway evaporates, miners may liquidate BTC holdings to pay debt or OPEX. This direct selling pressure coincides with secondary-ASIC dump into the spot market, depressing used-ASIC prices and tightening lenders’ collateral values.
Expected selling-pressure windows and timing
Selling pressure from miners is not uniform; it clusters around observable windows where liquidity needs or behavioral triggers align. Expect concentrated selling in these windows:
Immediate inventory clearing after OEM price cuts — OEM cuts often trigger two responses: immediate secondary-market pressure as resellers and operators reprice used-ASICs; and spot BTC sales by operators who had hoped for stronger resale values. This window is typically 0–90 days after the price cut announcement.
Post-difficulty jump lag (7–30 days) — difficulty increases reduce expected daily issuance; miners with thin liquidity may sell BTC as revenues drop. Because mining revenue is realized daily but accounting is monthly/quarterly, small operators can run out of cash quickly.
Quarterly/financial reporting and debt covenant dates — miners with debt obligations often face forced selling ahead of covenant tests or interest payments; these windows are predictable and can result in outsized flows.
Hardware refresh cycles — when operators replace older rigs en masse (often after new models are discounted), used-ASIC supply spikes and distressed sales occur. Timing is model-dependent but often follows OEM refresh announcements by 1–6 months.
Macro BTC price shocks and halving-related skepticism — if BTC price falls sharply, previously marginal operators immediately become loss-making and sell reserves to cover payroll and power.
Each window has different liquidity characteristics: OEM/refresh dumps depress ASIC resale values; covenant-related BTC sales have more direct spot-BTC market impact. Institutional players should model these windows explicitly in stress tests.
Policy implications and recommended strategies for miners and institutional allocators
For mining operators (capex and balance-sheet focus):
- Stress-test all-in economics with variable hashprice scenarios: run sensitivities for ±30–50% difficulty swings and ±40% BTC price moves on 1, 3 and 12 month horizons.
- Staged capex: prefer phased buildouts conditional on realized hashprice and PPA availability rather than lump-sum purchases. Use option-style procurement (reserve + ship) where available.
- Hardware mix: adopt a two-track strategy — keep a core fleet of high-efficiency rigs for baseline production and opportunistic buys of discounted older-gen ASICs for short-duration arbitrage when resale markets exist.
- Liquidity buffer & hedging: maintain BTC buffers vs OPEX and service debt with hedges (futures/options) where appropriate to limit forced BTC sales during stress windows.
- Power contracts & location: lock long-term low-cost power where possible; consider relocating flexible assets to regions with negative correlation in power price.
- Balance-sheet conservatism: avoid long-duration debt denominated in fiat if BTC-denominated revenues are volatile; prefer revolvers and asset-backed credit lines with conservative haircuts on ASIC collateral.
For institutional investors and analysts:
- Evaluate miner exposure to secondary-ASIC price moves: treat hardware inventory as marked-to-market with a stressed depreciation curve that reflects OEM discounting events.
- Focus on all-in cost per BTC (opex + depreciation + interest) not just breakeven electricity; use that to rank operators and to value potential M&A targets.
- Treat capital deployment as staged: prefer structures with milestone tranches, or convertible debt that protects downside from ASIC-value compression.
- Monitor the ASIC secondary market and OEM pricing as leading indicators of industry stress. Manufacturers’ inventory moves (like Bitmain’s cuts) are early warning signals.
Mentioning Bitlet.app in context: platform providers and counterparties like Bitlet.app can play a role in offering structured financing and BTC off-take solutions that reduce forced-sell risk for smaller operators.
Decentralization, consolidation and long-term BTC supply pressure
Consolidation is the near-term equilibrium: higher-cost, leveraged, or operationally inefficient miners will either sell assets or be acquired by low-cost operators. That process concentrates hashrate and increases systemic importance of large firms and their power contracts, raising centralization risks.
However, cheaper new-unit pricing has an offsetting effect: it lowers the capital barrier for new entrants and hobbyist farms, which can partially counterbalance centralization over the medium term. The net effect depends on power-cost distribution — if low-cost power remains concentrated in a few regions, consolidation will likely dominate.
From a BTC supply perspective, miner selling pressure is episodic. While capitulation windows create transient downward pressure on BTC price, long-term issuance is fixed by protocol schedule. The short-to-medium-term issue is that miner liquidity needs can amplify market volatility when selling coincides with weak market depth.
Conclusions and action checklist
- Bitmain’s deep price cuts and a ~35% rise in difficulty in 2025 are jointly compressing miner economics: cheaper hardware lowers capex but also accelerates depreciation and secondary-market price decay while rising difficulty reduces revenue per TH.
- Winners will be low-cost operators with conservative leverage, disciplined staged capex, access to cheap power, and active liquidity/hedging programs. Marginal players face triage, consolidation, or capitulation.
- Institutional investors should stress-test all-in costs, monitor OEM pricing and used-ASIC markets, and structure capital with protective tranches.
Action checklist for mining operators and analysts:
- Recompute all-in cost per TH under stressed difficulty and BTC price scenarios.
- Build a 3–6 month liquidity runway and a hedging plan for BTC revenues tied to debt/covenants.
- Use staged procurement and negotiate flexible delivery/return terms with OEMs if possible.
- Monitor OEM discount announcements and used-ASIC supply as leading indicators.
Sources
- Bitmain price cuts and inventory context: Bitmain slashes Bitcoin mining hardware prices up to 60%
- Difficulty data and net rise in 2025: Bitcoin mining difficulty rose 35% in 2025 — data
For more on long-term market structure and miner behavior, see industry analyses and primary OEM announcements, and consider integrating these dynamics into your next-quarter capex model. For technical readers interested in supply-side narratives, note how changes in OEM pricing policy and credit availability can be early indicators of broader consolidation trends — and how those trends feed back into the Bitcoin network's decentralization profile and market liquidity.