Forensic Breakdown: Christmas Bitcoin Flash Crash on Binance USD1
Summary
The event in short: what traders saw and why it mattered
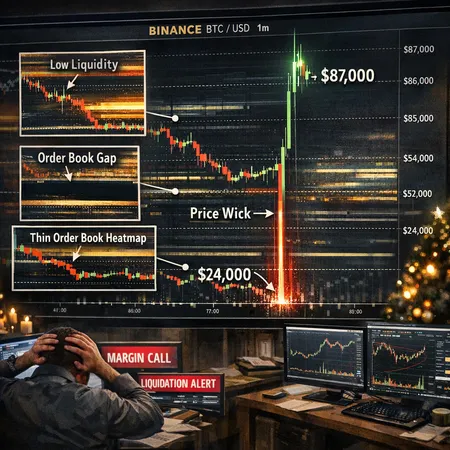
On December 25th, certain market feeds showed a dramatic drop in BTC price on Binance’s BTC/USD1 pair — a wick down toward ~$24,000 followed within seconds by prints back up near ~$87,000. Coverage of the anomaly can be found in contemporaneous reports such as CryptoNews, TokenPost and independent analysis in CoinTribune. To many retail chart watchers the candle looked catastrophic; to practitioners who understand market microstructure it was a liquidity event on a narrow venue — a textbook price wick that should have been treated as an anomaly, not a regime change. For context, platforms across the ecosystem (from centralized venues to services like Bitlet.app) rely on cleaner aggregated pricing for risk and execution decisions.
How a wick is born on a low-liquidity pair
A price wick — a thin, extreme tail on a candle — is simply the footprint of a few trades executed at prices far from prevailing quotes. On low-liquidity pairs like the BTC/USD1 listing:
- Shallow order books mean large market orders quickly eat through best bids or offers. When bids are thin, one aggressive market sell can match with distant bids, printing trades at extreme prices.
- Price matching rules on an exchange will execute whatever resting orders exist; there is no magical safety net unless the venue enforces filters.
- Hidden orders and IOC/FOK behaviors can exacerbate the illusion: an apparently single print may reflect a complex matching of visible and hidden liquidity across price levels.
Mechanically, imagine a visible top-of-book bid at $86k, but only a few contracts behind it. A 10x sized sell market order sweeps the book down through $80k, $60k, $40k and then consumes a tiny hidden bid resting at $24k. The tape shows trades at those prices and aggregated chart providers convert them into a candle with a long lower wick.
Why the USD1 pair specifically amplified the effect
Not all USD pairs share the same depth. Some synthetic or newly listed USD-denominated pairings can attract lower market-making commitment and fewer institutional participants. Low resting liquidity plus sporadic taker flow creates conditions where a small number of aggressive orders produces outsized prints.
Why chart feeds and market data can misrepresent actual market stress
Crypto lacks a single consolidated tape. Many retail charts simply plot the last trade on a particular exchange and pair. That means: a single, isolated trade at an extreme price will create an OHLC candle suggesting the whole market moved. Key points:
- Last-trade vs. index/mark price: Exchanges and margin systems should reference a robust index or time-weighted price (mark) rather than the raw last trade. If margin calls are driven by the last-traded price on a thin pair, liquidations follow unnecessarily.
- Aggregators smooth noise: Index providers (and prudent risk engines) use multiple venues and exclude outliers or apply clipping. Without aggregation and outlier rejection, feeds are noisy.
- Latency and feed splits: A delayed feed or an unbalanced presence of liquidity on a single venue can make that venue’s prints seem dominant in downstream charts, even when other venues remain stable.
Reports of the Binance BTC/USD1 wick underscore precisely this issue — several outlets noted the dip-and-rebound looked like a sharp wick rather than a wider market collapse (CryptoNews, TokenPost).
Exchange mechanics, margin systems, and the danger of relying on raw trades
For exchanges and risk teams, this incident should be a cautionary tale about how mark pricing, auto-liquidations, and circuit rules are configured.
- Mark price vs. trade price: A conservative mark price typically blends spot indices, funding rates, and a TWAP to avoid flash trade manipulation. If an exchange ties margin calls to the last trade on the same thin pair used for execution, forced liquidations can cascade.
- Auto-liquidation mechanics: High-leverage positions with tight maintenance margins are vulnerable to a single spoofed or accidental sweep of a shallow book.
- Systemic exposure through cross-margining and insurance funds: If an exchange fails to protect the insurance fund from being drained by mass liquidations triggered by a single bad print, the venue’s solvency and counterparty risk rise.
Practically: exchanges should reject or flag trades that deviate beyond a dynamic threshold from a multi-venue reference price and have a short window to unwind or cancel obviously erroneous prints.
How to spot and avoid getting burned by similar anomalies (for traders and risk managers)
This section gives hands-on defensive techniques.
- Prefer limit and post-only orders: Market orders are simple to use but will execute at whatever price is available. Use limit or post-only orders where possible, especially on low-liquidity pairs.
- Treat stop-market orders with suspicion on thin pairs: Convert discretionary stop-market orders to stop-limits with a realistic price cushion, or place stops on a cross-exchange aggregated mark instead of the local last trade.
- Monitor multi-venue VWAPs and index prices: If the cross-exchange VWAP or the index stays steady while a single venue prints an outlier, assume that print is anomalous.
- Size and leverage discipline: Reduce leverage on pairs with shallow depth and avoid size that would require crossing multiple days’ typical volume to fill.
- Pre-trade liquidity checks: A quick check of the top N levels of the order book (for example, the top 5 levels) tells you how much you’ll move the price. Advanced traders build slippage-estimation models: expected impact ≈ k * (size / ADV)^alpha.
- Watch spread and depth changes, not just price: A sudden widening of spread or collapse of bid-side depth often precedes violent prints.
These steps help keep your position from being liquidated on an anomalous tape print rather than a real market move.
Practical fixes exchanges and custodians should adopt
To protect users and the wider market, exchanges (and by extension regulators overseeing them) should implement a layered risk architecture:
- Aggregated mark pricing: Use a multi-venue, outlier-filtered index for margining and PnL calculations. This prevents raw last-trade prints on a thin pair from triggering mass auto-liquidations.
- Dynamic trade filters: Reject or hold trades that exceed a configurable deviation from the reference price (for example, >X% in Y seconds) until human or automated review confirms validity.
- Pre-trade liquidity checks: Orders above a size threshold should undergo an automated impact simulation; if predicted slippage is extreme, require confirmations or split execution.
- Circuit breakers and micro halts: Temporary halts for a pair when volatility or mismatch between last trade and mark price exceed thresholds.
- Transparency and user warnings: Clearly mark low-liquidity pairs and show top-of-book depth, so users are informed before trading.
- Custodial separations and insurance: Maintain robust segregation of customer funds and a well-sized insurance fund; stress-test the insurance fund against extreme, but plausible, single-pair events.
Regulators should consider requiring exchanges to publish how mark prices are calculated and to enforce minimum liquidity commitments for USD-denominated pairs.
Quick checklist: what risk teams should implement this week
- Ensure the margin engine uses a vetted multi-venue index for mark prices.
- Add or tighten filters that mute trades beyond X% of the reference within a short detection window.
- Add pre-trade impact modeling for large orders and implement mandatory split orders for heavy taker flow.
- Build an alerting system that flags when a single venue’s prints diverge strongly from the cross-venue consensus.
- Run tabletop exercises simulating a flash-wick: include order book snapshots, cascade simulations, and communications flow.
Closing thoughts — treat wicks as noisy signals, not definitive truth
The Christmas Day BTC/USD1 episode was unsettling, but its anatomy is useful: it reveals how exchange-level fragility and reliance on raw trade feeds can create outsized, avoidable pain for leveraged traders and poor outcomes for risk pools. A single thin-book print should not be permitted to act as the sole trigger for market-wide consequences.
For traders and risk teams, the golden thread is liquidity awareness: know the book, prefer conservative execution, and anchor margining to aggregated, outlier-resistant prices. Exchanges must harden mark-price logic and pre-trade controls so that markets remain usable and trustworthy — and regulators should require the transparency and protections that make those controls effective.
For deeper reading on how the print unfolded and was covered in the press, see the contemporaneous accounts listed below.
Sources
- CryptoNews — Bitcoin triggers sharp flash crash to $24k on Binance USD1 pair: https://cryptonews.com/news/bitcoin-triggers-sharp-flash-crash-to-24k-on-binance-usd1-pair/
- TokenPost — Exchange data and coverage of the plunge-and-rebound: https://www.tokenpost.com/news/investing/18101
- CoinTribune — Independent coverage questioning low-liquidity pair risks: https://www.cointribune.com/en/binance-bitcoin-price-dips-to-24111-and-quickly-rebounds-to-87000/?utm_source=snapi
Related reading: for context on broader market structure and decentralized liquidity, see discussions on Bitcoin and exchange mechanics on Exchange.