Spot XRP ETF Boom: Supply Squeeze, TOXR Launch, and 30–90 Day Scenarios
Summary
Why a spot XRP ETF can create a supply squeeze
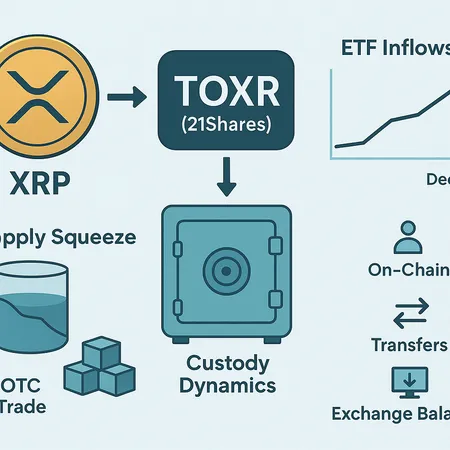
A spot ETF for XRP changes where tokens sit and how they flow. Unlike retail wallets or exchange order books, ETF custodians hold fiat-settled inventory off-exchange under long-term mandates; those tokens are effectively removed from day-to-day market liquidity. When large Authorized Participants (APs) and institutional desks buy XRP to create ETF shares, they draw from OTC inventories and exchange liquidity, tightening available supply for spot trading. This is the core of the supply-squeeze thesis: sustained ETF creation acts as a one-way drain on liquid XRP until redemptions or selling by custodians replace it.
The market has already started pricing this dynamic. Reporting suggests rising ETF demand is tightening available supply, and narratives around a vanishing free float are circulating among desks and retail alike. For many traders this sounds familiar — think of how inflows into spot bitcoin ETFs altered liquidity and correlation — but XRP has a different holder distribution and on-ledger mechanics, so the impact can be quicker and more concentrated.
The TOXR launch: timing, mechanics, and immediate significance
21Shares confirmed a U.S. spot XRP ETF (TOXR) set to launch on December 1, which formally puts another large, regulated buyer into the ecosystem that must acquire and custody real XRP for each ETF creation 21Shares TOXR launch. The operational loop is straightforward: APs source XRP (from OTC desks, exchanges, or large holders), deliver it to the ETF’s custodian, and receive ETF shares that can be sold in secondary markets. Each creation reduces the pool of XRP available to trade freely.
Two practical implications matter immediately. First, authorized participants and custodians are likely to source inventory via OTC blocks to minimize market impact, which pulls large chunks of supply off exchanges and into cold custody. Second, because ETFs target predictable, recurring inflows, this isn’t necessarily a one-off; sustained creation over weeks can materially reduce exchange reserves and narrow order book depth, increasing slippage for large spot trades.
Evidence for a supply drain: custody and OTC dynamics to watch
There are three tangible signals that corroborate a supply-drain thesis: falling exchange reserves, rising custodian receipts (when reported), and an increase in large, irregular transfers from known liquidity pools to custody addresses. Desk chatter and coverage have suggested a shrinking visible supply as ETF demand heats up; one report framed this as a pre-BlackRock-style shortage driven by ETF appetite and custodial accumulation ETF frenzy triggers XRP shortage.
Operationally, OTC desks will prioritize block trades for APs to fulfill creation baskets. Those block buys reduce available resting liquidity on exchanges and compress the ‘natural’ sell-side, especially when large holders choose to transfer into custody rather than sell into market depth. Since XRP historically has periods of concentrated whale holdings and scheduled escrow releases, the net balance — how much supply is moving into custody versus being released or sold — becomes the decisive factor.
Timeline and sizing: how big could ETF inflows be, and how fast?
Estimating flows is necessarily probabilistic, but framing a few plausible paths is useful. Spot ETF inflows depend on three drivers: AP appetite (driven by secondary market demand for ETF shares), institutional allocation shifts, and retail ETF uptake via broker channels.
Fast-adoption scenario: Heavy institutional allocation and retail interest lead to daily net creations equivalent to 0.25–1% of daily circulating turnover. Over 30 days this can remove low-single-digit percentages of the free float; over 90 days the effect compounds as APs and custodians keep adding. Because the ETF requires real XRP, such sustained demand would show up quickly as falling exchange balances and increased custody receipts.
Moderate scenario: APs fulfill periodic baskets and inflows average smaller amounts (e.g., 0.05–0.2% of daily turnover). The drain is real but slower; market participants see creeping exchange balance declines and higher volatility during liquidity shocks.
Slow/weak-adoption scenario: ETF flows remain tepid, with intermittent creation and occasional redemptions. This produces minimal structural change to circulating supply and market structure.
Remember that inflows aren’t only about the ETF’s NAV; secondary market trading of ETF shares can drive additional creations if APs arbitrage price differences, so liquidity in ETF markets themselves feeds the underlying demand loop.
On-chain and market indicators to monitor (what to watch next 30–90 days)
If you want to detect a real supply squeeze early, track a combination of on-chain metrics and off-chain market signals: exchange reserves (total XRP on centralized exchanges), large transfers (>1M XRP movements), custodian address receipts (public or reported), OTC desk inventories (via desk surveys or market color), block trade frequency and size, futures open interest, and funding rates.
On the technical chart side, watch order-book depth on top centralized venues, bid-ask spreads, and momentum indicators: a tightening order book with widening intraday gaps implies liquidity fragility. Standard technical levels to monitor include the 50- and 200-day moving averages, the recent local support range (established lows since launch), and RSI extremes. Pay attention to divergences between futures open interest and spot balance shrinkage — rising futures OI while exchange reserves fall is a classic recipe for higher realized volatility.
Also consider cross-market signals: when APs and custodians source from OTC, you may see decreased fiat liquidity on broker desks and increased block trade prints. For managers used to watching Bitcoin ETF launches, similar patterns — but compressed in time — can occur in alt markets like XRP.
Downside risks if ETF flows cool: the unwind mechanics
The same mechanics that can prop prices when ETF demand is strong can exacerbate losses if flows cool. If ETF buyers pause or redemptions begin, custodians may become sellers of underlying XRP either directly into OTC desks or through AP-mediated liquidations. Once sell pressure hits thin order books with compressed depth, slippage can magnify price declines.
A contrarian risk cited by market coverage is that ETF flows could weaken or reverse as macro conditions change or as secondary ETF performance disappoints; one analysis flagged weakening ETF flows and technical/fundamental signals that could cap upside and increase downside vulnerability ETF flows weaken; bearish signals intensify. Practically, a fall in NAV-based creations would put the previously-custodied supply back into OTC channels and eventually exchanges, increasing effective sell pressure unless new buyers appear.
30–90 day scenarios (probability-weighted playbook)
Bull (20–30% probability): Strong ETF adoption and repeat creations continue. Exchange reserves drop materially, order books thin, and price rises quickly. Liquidity tightens — larger spreads but meaningful upward repricing. Tactical implication: size in tranches, use limit fills and participation algorithms to avoid slippage.
Base (45–55% probability): Moderate, steady ETF creations produce a gradual supply drain. Volatility is elevated but manageable; price grinds higher with occasional pullbacks. Liquidity narrows in large-size windows but arbitrage between ETFs and spot keeps markets functional. Tactical implication: lean long with strict risk controls; watch custodian receipts and AP flows to scale.
Bear (20–35% probability): ETF flows falter or reverse, possibly triggered by broader risk-off or a technical breakdown. Previously-custodied XRP returns to market through redemptions or forced selling, producing rapid liquidity expansion to the downside and widening spreads. Tactical implication: be prepared to hedge quickly (futures, options where available) and avoid large unhedged exposures during re-entry.
These probabilities should be adjusted by portfolio managers to reflect fund mandates, time horizons, and correlation to broader risk assets. Liquidity outcomes are non-linear: a small change in ETF flows can have outsized market impact when order-book depth is already compressed.
Tactical checklist for portfolio managers and savvy traders
- Monitor daily exchange reserves and large transfers; treat a persistent multi-week decline as confirmation of a structural drain. Use automated alerts where possible.
- Track AP creation/redemption prints if custodians or ETFs publish them; these are direct, high-confidence signals of buying or selling pressure. Combine with OTC desk color and block trade frequency.
- Manage entry size: with thinner depth, use VWAP/TWAP algorithms and staggered limit orders to avoid paying large premia. For large portfolios, pre-arrange OTC executions with multiple desks to reduce slippage and signaling risk.
- Hedge where appropriate: futures open interest, inverse products, and options (if liquid) can protect against sudden reversals. Funding rates and basis between spot and futures will be telling.
- Keep an eye on correlated markets and macro flows; ETF demand is not insulated from broader risk-on/risk-off cycles. Also watch how other products (like spot BTC/ETH ETFs) are moving since flows and sentiment can correlate across ETFs.
Bitlet.app users and other traders should integrate both on-chain scripts and market data feeds to triangulate true supply movement rather than relying solely on price action.
Conclusion: asymmetric dynamics — upside amplification and downside fragility
A spot XRP ETF like TOXR materially changes the demand plumbing for XRP; custodial accumulation and AP-driven sourcing can drain liquid supply and amplify price moves. The supply-squeeze thesis is credible when you observe falling exchange balances, rising custody receipts and heavy OTC block activity — signals already flagged by market reports. But that same plumbing means the system is asymmetric: inflows lift prices, and an abrupt cooling of ETF demand can flush previously locked supply back into markets, creating outsized downside.
For portfolio managers and savvy traders, the playbook is straightforward but operationally demanding: monitor on-chain and off-chain flow metrics closely, size entries to account for compressed depth, and be ready to hedge or pare positions if ETF flows slow. Scenarios over the next 30–90 days should be probability-weighted and stress-tested against liquidity shocks rather than purely directional forecasts.
Sources
- CoinPaper — ETF frenzy triggers XRP shortage before BlackRock even enters; framing the supply-squeeze narrative: https://coinpaper.com/12744/etf-frenzy-triggers-xrp-shortage-before-black-rock-even-enters-digital-ascension-group-ceo-sounds-the-alarm?utm_source=snapi
- CoinPedia — 21Shares XRP ETF (TOXR) set to launch on Dec 1: https://coinpedia.org/news/21shares-xrp-etf-set-to-launch-on-1-december-as-etf-demand-surges/
- FXEmpire — ETF flows weaken and bearish signals intensify (counterpoint risk analysis): https://www.fxempire.com/forecasts/article/xrp-news-today-etf-flows-weaken-as-bearish-signals-intensify-1564515
For comparative context on how ETF launches have altered market structure in other assets, see precedents in spot ETF adoption and their effects on on-chain liquidity and order-book depth. Also consider monitoring adjacent markets such as DeFi where liquidity fragmentation can create cross-market spillovers.