Bitcoin’s Late‑November Rebound: Durable Bull Leg or Short Relief Rally? Scenarios & Risk Plans
Summary
Executive snapshot
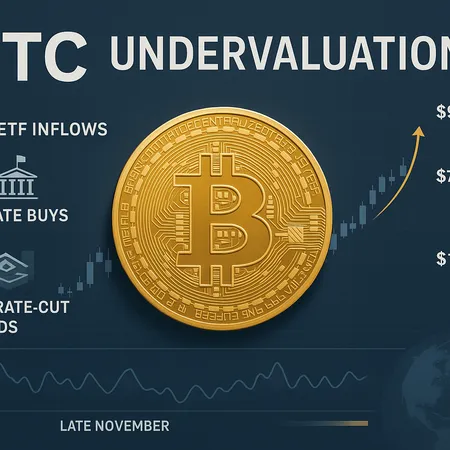
Bitcoin's late‑November rebound has drawn fresh headlines: price strength, renewed ETF interest, and macro chatter about earlier than expected Fed easing. For many traders the central question is simple — is this the start of a sustained bull leg or merely a relief rally? This piece parses on‑chain and institutional signals, the role of ETF inflows and state‑level buys, how rising Fed rate‑cut odds change liquidity dynamics, technical scenarios that map $75k–$96k outcomes, and practical risk‑management frameworks you can apply to actual positions. For many allocators, the same frameworks apply whether you trade via an exchange or manage exposure through platforms like Bitlet.app.
What changed and why now: ETF/state buys plus macro context
Several factors converged to lift BTC price action in late November. First, renewed ETF inflows and media coverage of large allocations have improved the narrative that demand is structural rather than purely speculative — a sentiment that often changes order flow dynamics. Analysts and price commentators have pointed to this as part of the rebound thesis; see price coverage and analysis describing BTC flirting with higher targets in the same period (for market framing, see this roundup on Bitcoin momentum and accompanying analysis).
Second, public reports and anecdotal institutional buying — sometimes referenced as state or large‑sized allocations — add another layer of real demand that can tighten free float in the short term. While exact figures and buyers are not always transparent, the combination of ETFs, custody-friendly channels, and large account activity can materially reduce supply on exchanges and quicken rallies.
Third, macro matters: Fed rate‑cut odds rose meaningfully in that window, which historically lowers the real yield environment and can lift risk assets. Coverage showing Fed rate‑cut probability increases aligns with BTC strength, and analysts have tied those odds to liquidity flows into crypto Blockonomi and market rebound narratives Crypto‑Economy. Put together, these three threads — ETF/state buying, tightening exchange supply, and easier macro liquidity — explain why the rebound has more legs than a one‑off short squeeze, but they do not guarantee a sustained new bull market.
On‑chain and institutional indicators: mixed signals
On‑chain metrics show nuance rather than clean confirmation. Some accumulation signals are present: reduced exchange balances, longer‑term wallet retention, and large buy clusters that coincide with ETF flows. These patterns are what institutional participation proponents point to when arguing for a durable leg higher. However, several risk metrics temper that optimism. Recent analysis highlights weakening momentum on certain on‑chain velocity and activity measures, implying that while price is higher, underlying network usage and certain risk metrics haven't fully normalized (AmbCrypto). Sentiment vectors — social volume, derivatives positioning, and retail FOMO — can also flip quickly; sentiment data providers warned that the bounce doesn't necessarily equal a bottom (Coinspeaker).
Institutional flows matter more than they used to. Authorized participant flows into spot ETFs, custody inflows, and reported large buys reduce available liquid inventory. But institutional buying is lumpy: it can start a multi‑week trend or stall if macro data or correlations with equities reassert themselves.
Macro lens: why Fed rate‑cut odds amplify the move
Rising Fed rate‑cut odds change the plumbing of risk markets: lower rates tend to push more capital into yield‑seeking and risk assets, reduce the dollar's real yield, and make leveraged carry trades cheaper. Reporting noted that Fed rate‑cut odds jumped and correlated with BTC strength, an important macro catalyst to watch Blockonomi. That said, timing is everything — markets often price rate expectations ahead of official moves, so BTC can be sensitive to economic prints that alter those probabilities.
The key implication: even if ETF and state buys are genuine, a sudden shift in macro (higher‑than‑expected inflation prints, hawkish Fed speak, or an equity flash selloff) could remove liquidity rapidly, turning a rally into a volatile chop or correction. For traders, this means the macro backdrop should influence position sizing and hedging decisions.
Technical scenarios and trade frameworks ($75k — $96k)
Below are two practical scenarios with entry, target, stop guidance, and reasoning. Timeframes assume intermediate trading horizons (weeks to months).
Bull‑leg scenario: sustained push toward ~$96k (base case for continuation)
Thesis: Ongoing ETF inflows, reduced exchange supply, and improving macro liquidity sustain bids. Momentum indicators confirm and higher timeframe structure (daily/weekly) closes above recent distribution nodes.
- Entry: scale in from $84k–$88k on confirmed bids and positive volume profile. Consider a staggered sizing plan: 40% at $88k, 30% at $92k if momentum holds, 30% above $92k if breakouts sustain.
- Targets: initial take profit at $96k (primary technical extension and external analysis scope), secondary target near $108k if momentum and volume remain strong.
- Stops: initial protective stop at 7–10% below entry (e.g., if entry at $88k, stop ~ $79k–$81k). If price consolidates and holds above $88k for multiple days, tighten to a 5% trailing stop. Use size so that a stop loss equals no more than 1–2% of portfolio risk for allocators.
- Risk control: hedge partial position with short‑dated puts or inverse futures if volatility spikes or macro prints turn sour.
This scenario aligns with bullish technical calls that point to higher targets if continuation occurs; see technical commentary linking rebound potential to higher price bands in market analysis (Cointelegraph, Crypto‑Economy).
Relief‑rally scenario: fade toward ~$75k (bearish/mean‑revert)
Thesis: The bounce is liquidity‑driven and short‑lived; weak on‑chain metrics and technical divergence lead to profit taking and a re‑accumulation phase near prior support.
- Entry (short or fade): consider initiating small short exposure near $90k if you see exhaustion wick, negative volume divergence, or options skew favoring downside. Alternatively, wait for price to break below $84k and short retest moves up.
- Targets: first downside target $80k, second $75k as a more aggressive mean‑reversion level and liquidity magnet.
- Stops: tight stop for shorts — limit losses to 4–6% above entry in case of squeeze. If shorting via futures, maintain strict collateral management to avoid liquidation in squeezes.
- Risk control: prefer buying protective calls or using limited‑loss structures (buy/put spreads) if shorting with options.
This relief scenario is supported by cautionary on‑chain and sentiment reads that indicate bounces can fail absent broad activity improvement (AmbCrypto, Coinspeaker).
Practical risk‑management checklist for allocators and traders
- Position sizing: cap any new directional trade such that a full stop represents <=1–2% of total portfolio capital for long‑term allocators, or smaller for short‑term traders depending on volatility tolerance.
- Use staggered entries: avoid all‑or‑nothing buys at a single price; layer buys across 2–4 levels to reduce miss risk and improve average price.
- Stops and management: define stops before entering. Convert to trailing stops after favorable movement to lock gains without premature exit on normal volatility.
- Hedging: use options spreads (bull call spreads or put spreads) to express views with defined risk. For quick protection, inverse ETFs/futures or short options can work — but account for funding rates and margin.
- Portfolio context: rebalance fixed allocations vs. dollar‑cost average strategies. If BTC is a strategic allocation, use pullbacks to rebalance into target weights rather than chase tops.
- Volatility guardrails: if realized volatility rises above historical ranges, reduce directional exposure and switch to hedged or buy‑and‑hold postures until volatility normalizes.
Why this matters to portfolios
Even if the rebound is a temporary relief, the event highlights how quickly liquidity and narrative can shift in crypto markets. For portfolio managers, the key is translating short‑term technical setups into strategic decisions: tilt allocations during sustainable flows, hedge where tail risk is unacceptable, and avoid overleveraging in a still‑young market. Institutional participation via ETFs and large buys changes the supply/demand footprint, and the macro cycle (Fed rate expectations) determines whether that footprint gets amplified by liquidity.
Conclusion: a conditional yes — but plan for both outcomes
The late‑November bounce has credible inputs that could support a sustained bull leg — ETF inflows, reported institutional/state buying, and easier Fed expectations. Yet on‑chain and sentiment indicators inject caution. The prudent approach for intermediate traders and allocators is to prepare for both outcomes with explicit entry ladders, clear stop rules, position sizing that respects volatility, and selective hedging. Whether you lean bullish or expect a fade, translate your view into rules you can follow without emotion.
Sources
- https://crypto-economy.com/bitcoin-nears-90k-as-market-rebounds-is-this-the-best-time-to-buy-bitcoin-hyper/
- https://cointelegraph.com/news/bitcoin-eyes-rebound-96k-from-discount-zone-analysis?utm_source=rss_feed&utm_medium=rss&utm_campaign=rss_partner_inbound
- https://blockonomi.com/bitcoin-btc-price-trades-at-87500-as-fed-rate-cut-odds-jump-to-80/
- https://ambcrypto.com/is-bitcoin-losing-strength-ahead-of-2026-these-data-points-say-so/
- https://www.coinspeaker.com/think-bitcoin-bottomed-santiment-data-says-think-again/


