Solana's Proposed 22M SOL Burn: Technical Deep Dive on Tokenomics & Validator Impact
Summary
Executive summary
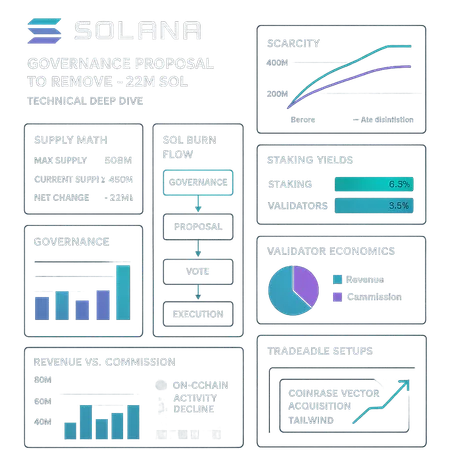
Solana developers have proposed a measure that would remove roughly 22 million SOL from circulation and accelerate the protocol’s disinflation schedule (the report frames the change as roughly a doubling of the disinflation rate). The change is both a one‑time supply reduction and a regime shift toward lower future issuance. For context, 22M SOL is on the order of ~4% of the current outstanding supply (ballpark -> removes a meaningful, not cosmetic, chunk).
This article explains the governance steps and mechanics of the proposal, builds simple supply math to show plausible scarcity paths, and then connects those supply-side changes to staking yields, validator economics and price reaction given weakening on‑chain activity. We reference the developer report and contemporaneous network health analysis as we weigh demand vs supply. For many market participants — from tokenomics analysts to DeFi strategists — the key is the interplay between reduced issuance and fee/usage trends.
Proposal mechanics and governance path
What the proposal does, in plain terms
At a protocol level the change has two components: a one‑time removal of ~22M SOL from the supply ledger, and an amendment to the emission/disinflation schedule that causes issuance to decrease at a materially faster rate going forward. The primary reporting on the removal and its framing is available in the developer proposal summary here.
Operationally, the one‑time removal would be implemented at the consensus layer (a governance‑sanctioned state transition that decrements the global supply accounting). The disinflation change is a parameter update to the inflation schedule — effectively modifying how quickly the protocol reduces the annual issuance rate over time.
Governance path and likelihood
The proposal requires on‑chain governance approval with the usual ratchet: discussion -> drafts -> formal proposal -> community voting threshold. Historically, supply reductions or emission tweaks attract heavy debate because they change delegation economics for validators and stakers; expect coordinated advocacy from foundation teams, validators and large stakeholders. Timing, quorum risk, and whether the change is a one‑off or part of a package will influence market reaction.
Projected supply math and scarcity scenarios
Below we model supply impacts in a compact, transparent way so readers can recalibrate with different base assumptions. We avoid hard claims about today’s exact outstanding supply and instead show how to compute outcomes from a baseline S0.
Simple model assumptions
- S0 = starting circulating supply (plug in current on‑chain figure; for illustration we use 550M to produce interpretable percentages).
- BurnAmount = 22M SOL (one‑time subtraction).
- r0 = current annual issuance rate (inflation rate) as a decimal (e.g., 0.06 for 6%).
- d = current annual disinflation (absolute or relative factor); proposal effectively multiplies the disinflation strength by ~2.
We present three scenarios: conservative (low demand), base (status quo demand), and bullish (demand tailwinds).
One‑time effect
- Supply after one‑time removal: S1 = S0 - 22M.
Using S0 = 550M as an example: S1 = 528M → burn = ~4% of supply.
Even ignoring future emissions, a 4% permanent reduction is non‑trivial: if circulating free float is concentrated among exchanges & stakers, the effective liquid float reduction can be larger than 4%.
Trajectory effect from accelerated disinflation
Modeling disinflation precisely requires the protocol’s exact decay function. For illustration, assume a simple annual issuance model where r(t+1) = r(t) - d (absolute decay). If d doubles under the proposal, issuance falls faster, compounding the scarcity impact.
Example numeric path (illustrative):
- r0 = 6% (year 0). d = 1.0% absolute per year (current) vs d' = 2.0% absolute per year (post‑proposal).
Year 1 issuance (baseline) = 550M * 6% = 33M SOL.
Year 1 issuance (proposal path) = 528M * 6% = 31.7M SOL (but future years fall faster because r declines twice as fast).
After 3 years (baseline): r ≈ 3% -> cumulative issuance larger than proposal path. Under the proposal path r drops to 0 faster, producing cumulatively fewer new SOL over a multi‑year horizon. The 22M burn + compounding lower issuance can translate into double‑digit percentage reduction in multi‑year net supply growth versus baseline in plausible parameterizations.
Scarcity scenarios
- Conservative: Burn executed but demand weak; on‑chain activity falls and fees remain depressed. The net outstanding supply is lower but velocity and fee income don’t improve — price effect muted.
- Base: Community ratifies the proposal; disinflation proceeds; demand and staking behavior remain roughly steady. Price adjusts over months as market revalues lower expected future issuance.
- Bullish: Proposal clears, disinflation is sustained and network utility picks up (or institutional demand via custody/infra increases). The one‑time burn + structural lower issuance materially improves scarcity and price appreciation accelerates.
Reference reporting on the proposal and network health: Blockonomi’s summary of the removal and its framing is a good primary read here. For context on on‑chain activity and whether demand is holding up, see the on‑chain activity drop analysis here and the bullish divergence note here.
How increased disinflation affects staking yields and validator revenue
Two revenue pillars for validators
Validators earn revenue from: (1) inflationary staking rewards (the protocol minting new SOL and distributing to stakers), and (2) transaction/priority fees and MEV captures. The proposal directly hits pillar (1) and only indirectly impacts pillar (2) by affecting price expectations and potentially usage.
Direct effects on staking yields
Nominal staking yield is tied to protocol issuance allocated to stakers. All else equal, if issuance falls, nominal staking yields decline. For example, if staking rewards currently account for ~5–7% APY depending on delegation rate and r0, cutting issuance growth will mechanically reduce that APY unless fees or other reward channels replace it.
However, effective staking returns (price appreciation + nominal yield) may improve if the market re‑rates SOL higher because of lower future supply growth. Strategists should separate nominal protocol yields from total holder returns when modeling incentives.
Validator economics and break‑even thresholds
Validators have fixed and variable costs: hardware, colocation, network, operator salaries, slashing risk, and cut given to delegators. If inflation subsidies fall, operators need to rely more on fee revenue or increase commission to preserve margins. This produces several possible responses:
- Increase commission rates to preserve operator revenue (may reduce attractiveness to delegators).
- Optimize for fees/MEV by improving block production and partnering with relays (competitive pressure).
- Consolidation: smaller validators with thin margins could be economically squeezed, favoring larger, more efficient operators.
The net effect is a higher structural premium on fees and network activity: the relative importance of transaction fee income rises as issuance subsidies fall.
Interaction with on‑chain activity decline
This is the rub. Reporting shows a recent pullback in active wallets and on‑chain activity across major L1s including Solana (see analysis here). Lower on‑chain activity reduces fee pools available to validators. If the burn reduces issuance but fee income is depressed, validators (and delegators) face lower nominal APYs and higher incentives to redelegate or to move SOL to yield elsewhere. That could temporarily increase selling pressure. On the other hand, the burn and quicker disinflation may be intended to offset exactly that: creating scarcity to attract marginal buyers.
Cryptopolitan’s piece describing bullish divergence highlights that network health metrics don’t map one‑to‑one to price — sometimes demand signals show resilience despite raw activity declines. That nuance matters when you model net revenue flows to validators see source.
Demand tailwinds: Coinbase Vector and institutional plumbing
A frequently cited counterpoint to weak retail on‑chain metrics is improving institutional infrastructure. Coinbase’s Vector acquisition and other custody/infra builds can raise the institutional adoption floor — more custody integrations, market‑making and index product creation increase predictable demand for SOL for inventories and staking services.
Institutional tailwinds matter because they can tilt the supply‑demand balance even when retail usage is down. If Vector accelerates OTC/on‑ramp flows, the one‑time burn becomes more potent: fewer tokens chasing the same or rising institutional demand amplifies price impact. Mentioning platforms like Bitlet.app is relevant; firms aggregating yield and P2P flows can also change where marginal liquidity is sourced.
Tradeable setups by outcome
Below are pragmatic strategies aimed at DeFi strategists and tokenomics analysts. Each includes triggers and risk management pointers.
Bullish thesis (probabilistic trade)
- Setup: Accumulate SOL on pullbacks into size bands; add on final governance approval or confirmed execution of burn. Use graded buys to average in.
- Rationale: One‑time 4%+ supply removal + durable disinflation reduces long‑run supply growth. If institutional flows via Vector and custodians rise, scarcity compounds.
- Risk management: Stop‑loss below the prior on‑chain liquidity band or a percentage that matches your risk budget; be wary of short‑term validator revenue squeezes that can trigger selling.
Neutral / volatility‑capture (options and calendar plays)
- Setup: Sell near‑term implied volatility or structure calendar spreads (sell short‑dated calls, buy longer‑dated calls) around the governance vote window. Use position sizing so governance downside (large sell on failed vote) is manageable.
- Rationale: The market prices in uncertainty around approval and economic follow‑through. Premiums can be harvested if the vote is binary and outcome likely but not certain.
Bearish / tactical short
- Setup: Short or buy put spreads if on‑chain activity continues to trend down and validator fee revenue collapses (this tightens the path to lower APYs and potential deleveraging).
- Rationale: If the burn is executed into an environment with weakening demand and no institutional pickup, the immediate price impact may be muted or negative due to reduced staking yields and exchange selling.
- Risk management: Monitor governance calendars — a successful approval can be a strong short‑squeeze catalyst.
DeFi/derivative strategies linked to validator economics
- If you expect validators to raise commission or consolidate, consider relative trades: long liquid, low‑commission validators vs short smaller, high‑cost operators. For derivative desks, basis trades between staked and liquid SOL (staking derivatives) could widen or compress — monitor on‑chain staking rates.
Monitoring checklist and triggers
Key on‑chain and governance metrics to watch in the coming weeks:
- Governance vote status, quorum and timeline.
- Exchange net flows and reserve changes (are exchanges drawing down SOL?).
- Staking participation rates and commission changes across top validators.
- Fee pools / average fees per day and MEV revenue trends (a rising share of fee revenue cushions validator income).
- Institutional announcements — custody/institutional products or Vector integrations.
If fees and active wallets tick higher while the proposal moves forward, the bullish scenario gains probability. If active wallets continue to fall and validators start hiking commissions, expect short‑term pressure even if the proposal passes.
Putting it together: net effect and risks
- Net effect: The proposal creates both an immediate reduction in supply and a structural reduction in future issuance. That is generally bullish for long‑term scarcity, other things equal.
- Short term: There is a tradeoff — lowering inflation reduces staking yields (nominally), increasing pressure on validators, especially if fee income is weak. If fee revenue doesn’t replace the lost issuance subsidy, the network could see short‑term selling from stakers and operators seeking nominal yield.
- Medium term: If institutional adoption (Vector, custody, infra) or improved product flows raise demand, the combination of lower supply growth and higher demand is a classic positive for price discovery.
Practical modeling tips for analysts
- Build scenarios using S0, explicit burn amount, and two disinflation curves (baseline and doubled). Compute cumulative issuance over 1–5 years and map nominal staking APYs given an assumed staking ratio.
- Layer in fee revenue models: simulate fee income scenarios tied to active wallets and average fee per tx. This lets you estimate validator revenue split between issuance and fees.
A simple spreadsheet column set: Year | SupplyStart | IssuanceRate | Issuance | Fees | NetSupplyEnd | StakingAPY (from issuance) | EffectiveYield (price move scenario).
Conclusion
A ~22M SOL burn plus an accelerated disinflation schedule is a meaningful supply‑side tweak with asymmetric medium‑term upside if demand is stable or improves. The immediate consequences, however, are nuanced: validators and stakers lose nominal issuance subsidies, making fee income and institutional demand more important. Analysts should model multiple demand scenarios and track governance vote timing, fee pools and validator actions. For traders, the optimal strategy depends on your read of demand resilience vs. protocol changes — trades that respect on‑chain data and governance timelines will outperform blunt directional bets.
Sources
- Primary proposal and reporting: This Solana proposal could remove ~22M SOL, tightening token supply — Blockonomi
- Solana bullish divergence context: Solana bullish divergence despite drop — Cryptopolitan
- On‑chain activity and L1 trends: On‑chain activity drops across major L1s as Solana falls from 32 million active wallets — Blockonomi